The bug that looks like healthy infrastructure
A PCB inspection model starts flagging boards as uncertain on one of two identical lines. Latency flat, GPU normal, all eight devices healthy. The cause was a board revision the model had never seen. This is what finding it looks like.
Volta Electronics manufactures PCBs for automotive suppliers. Tolerances are tight. A solder bridge or misaligned pad that passes visual inspection can cause a field failure months later.
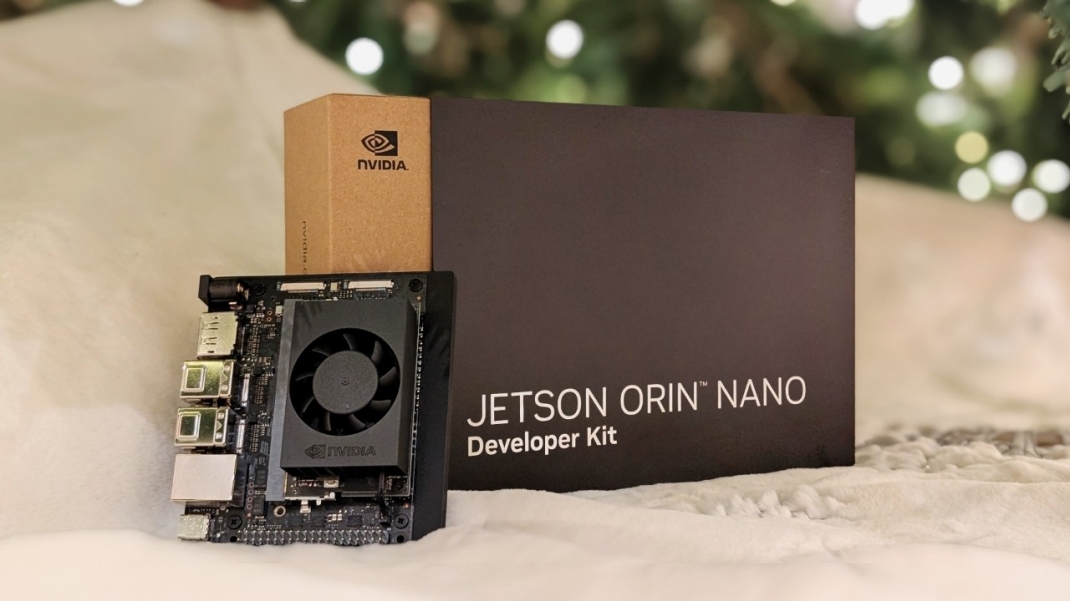
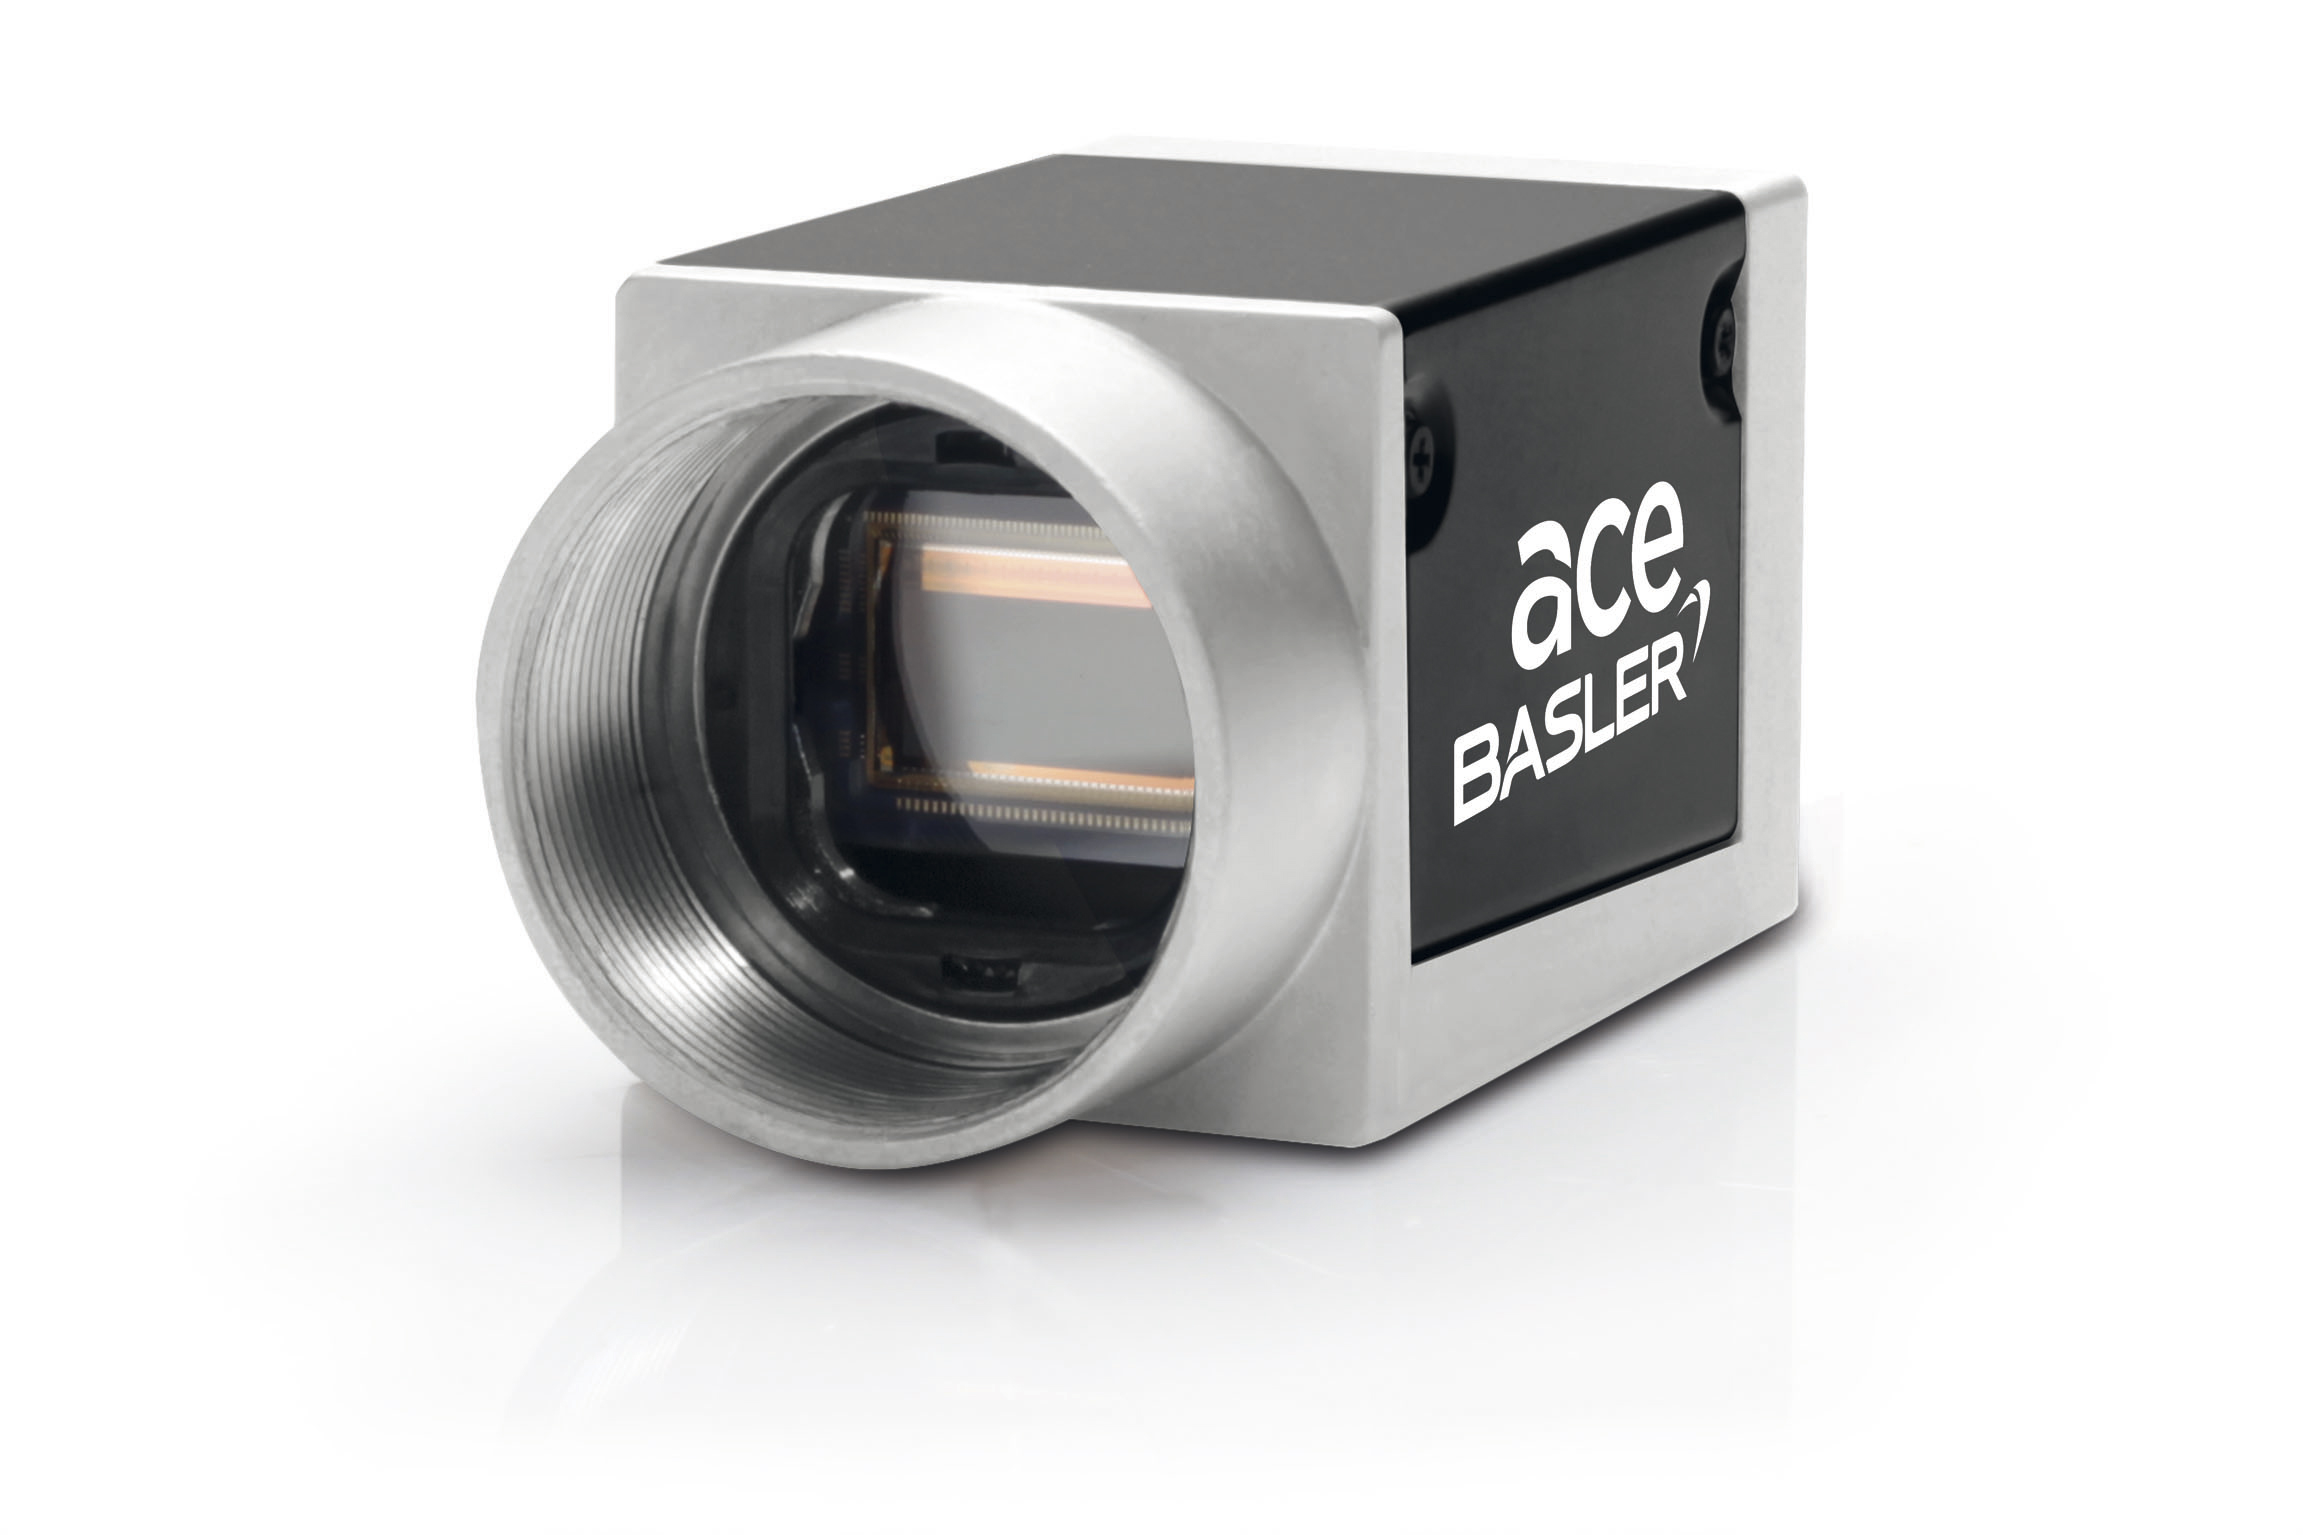
Volta runs eight Jetson Orin NX units across two PCB inspection lines, Line A and Line B, four cameras each. Every board passes a Basler acA1920 GigE camera before it ships.
A MobileNetV3-based defect detector (trained in-house, ONNX (Open Neural Network Exchange), running on the Jetson's CUDA execution provider) makes a call per board and predicts following classes:
- OK: pass the board
- DEFECT: kick it to the rework station
- UNCERTAIN: escalate to GPT-4o-mini for a structured defect report and flag for human review
The model was trained on three failure modes that account for 80% of Volta's rework: solder bridges between adjacent pads, missing or misaligned components, and cold joints visible as dull or irregular solder surfaces.
On a healthy line, UNCERTAIN sits around 8-10%.
Line A and Line B each have four cameras. Same model, same firmware, same deployment, running without issues for eight months.
Day -4: the Quality board flags a drift
The drift shows up first on the Quality page. The quality engineer sees this:
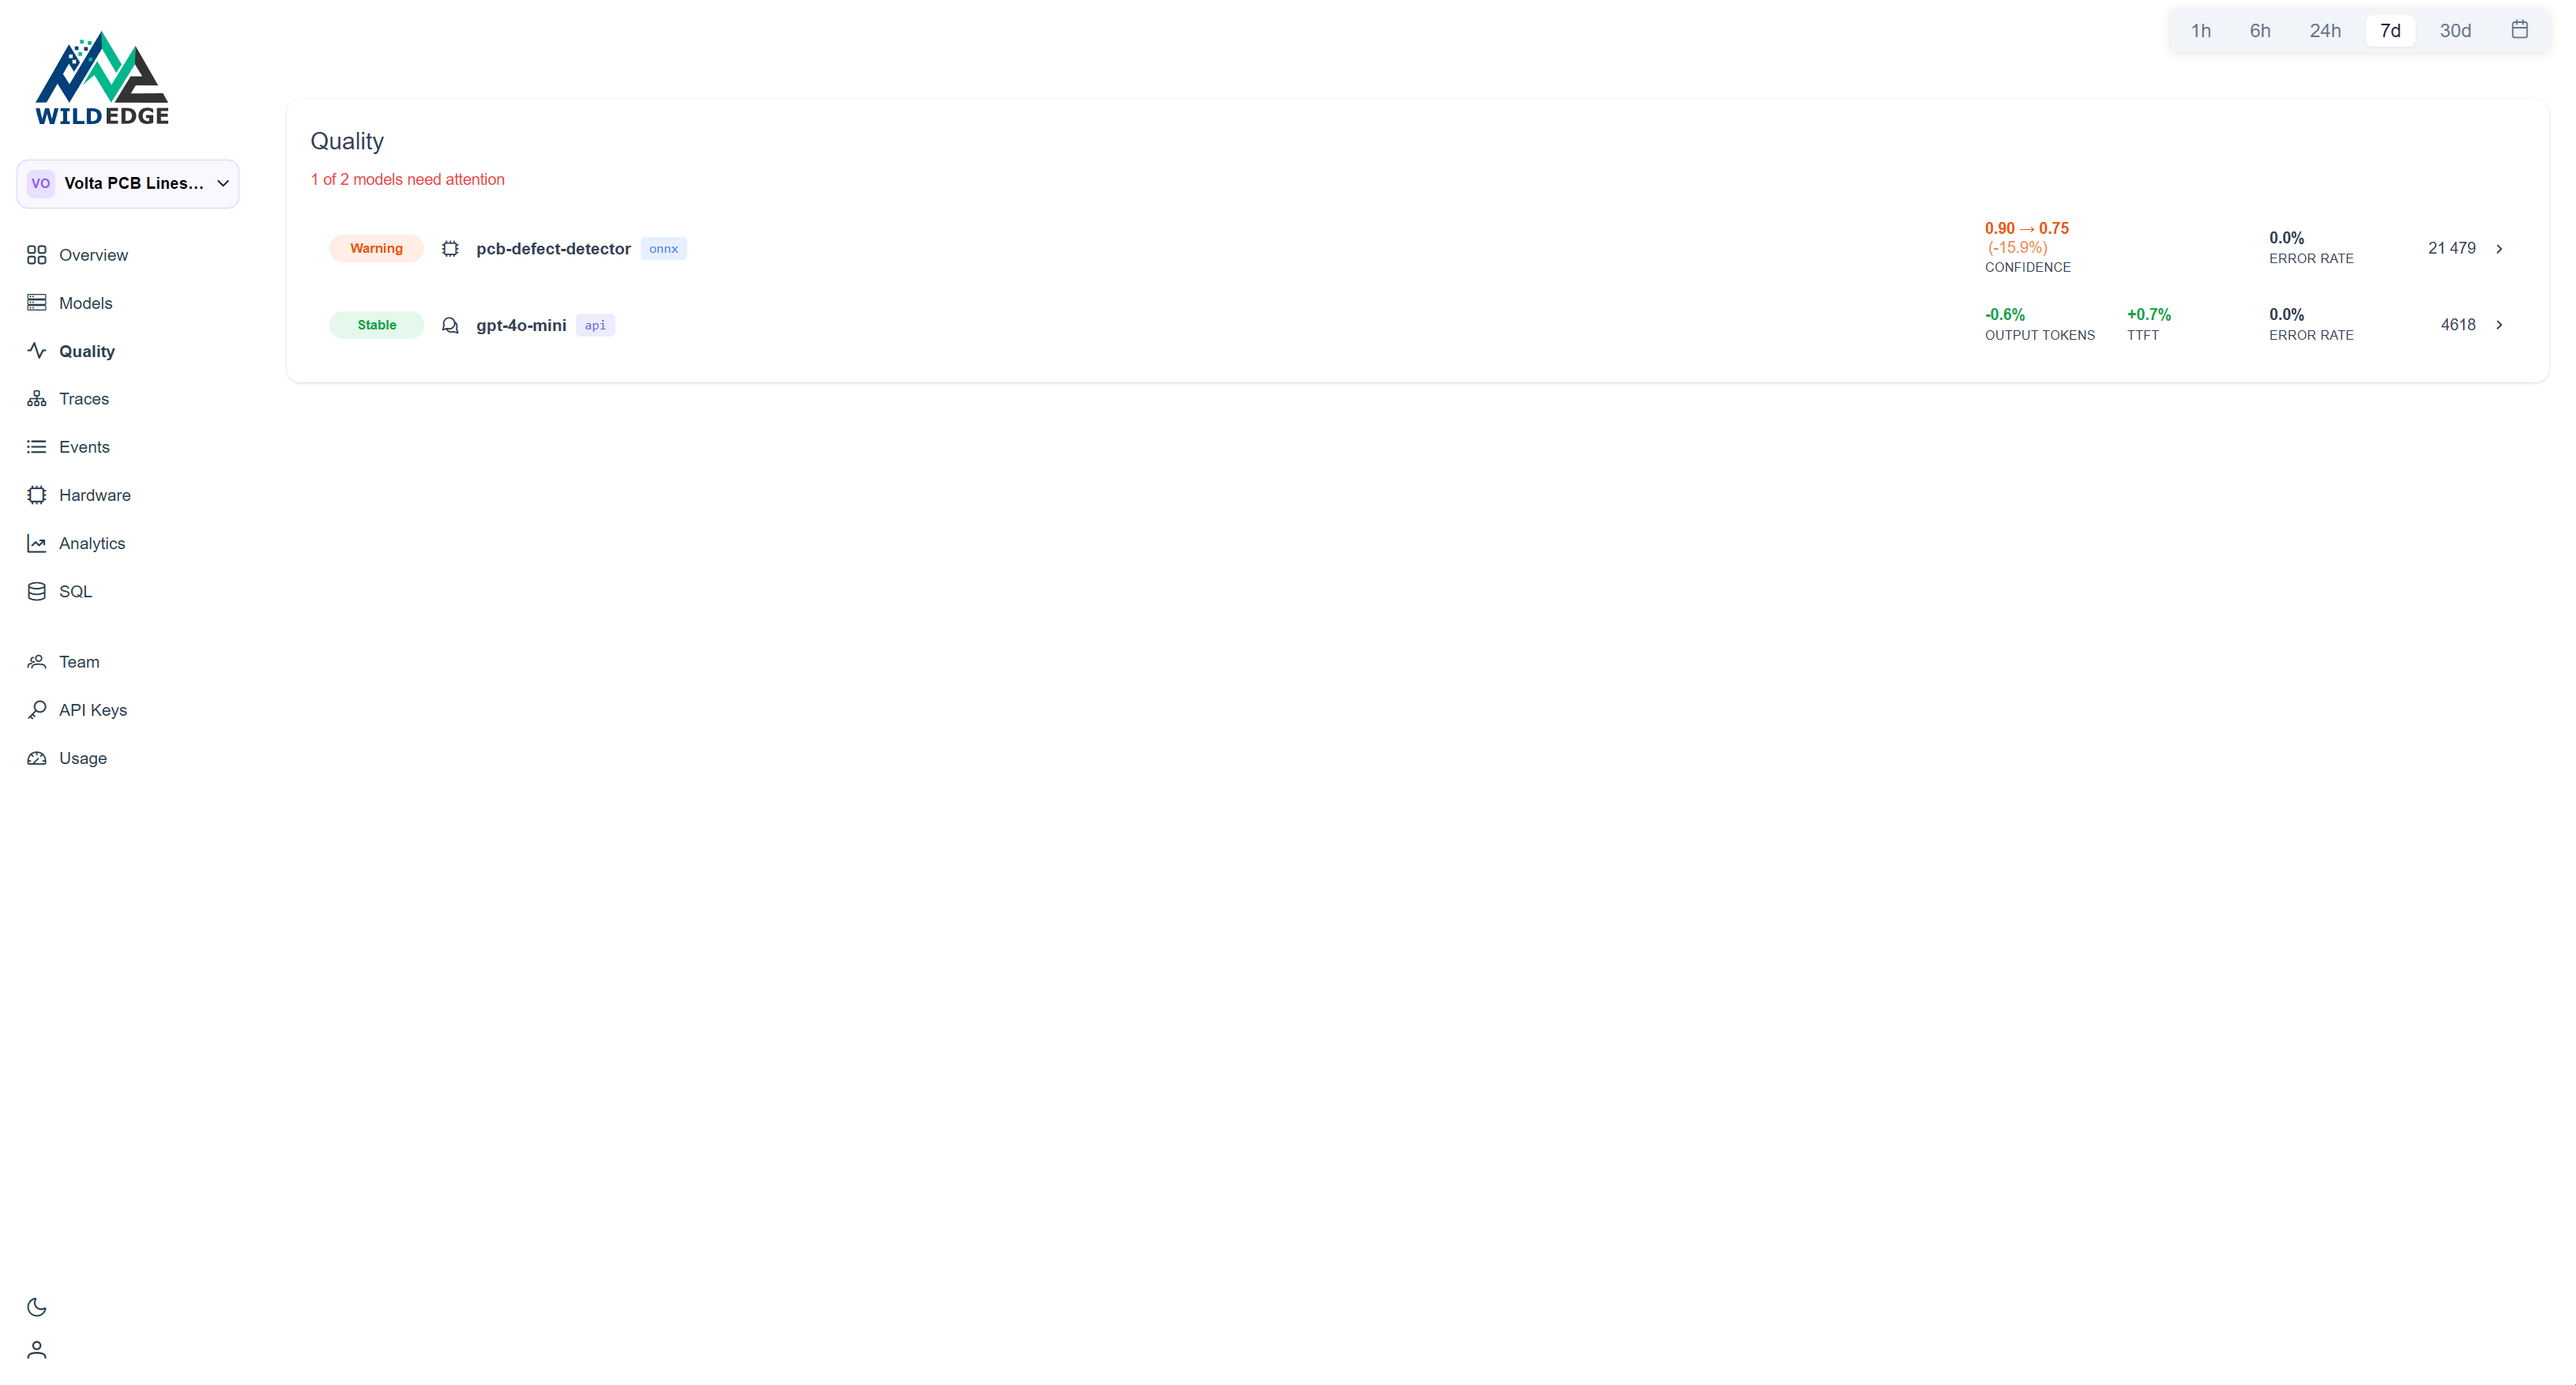
A 15.9% drop in average confidence. The first instinct is hardware: camera shifted, Jetson overheated, ONNX Runtime got updated. The device breakdown rules that out in about ten minutes.
The model detail page
Clicking through shows confidence trending normally through day -4, then a clean break. Not gradual. An event.
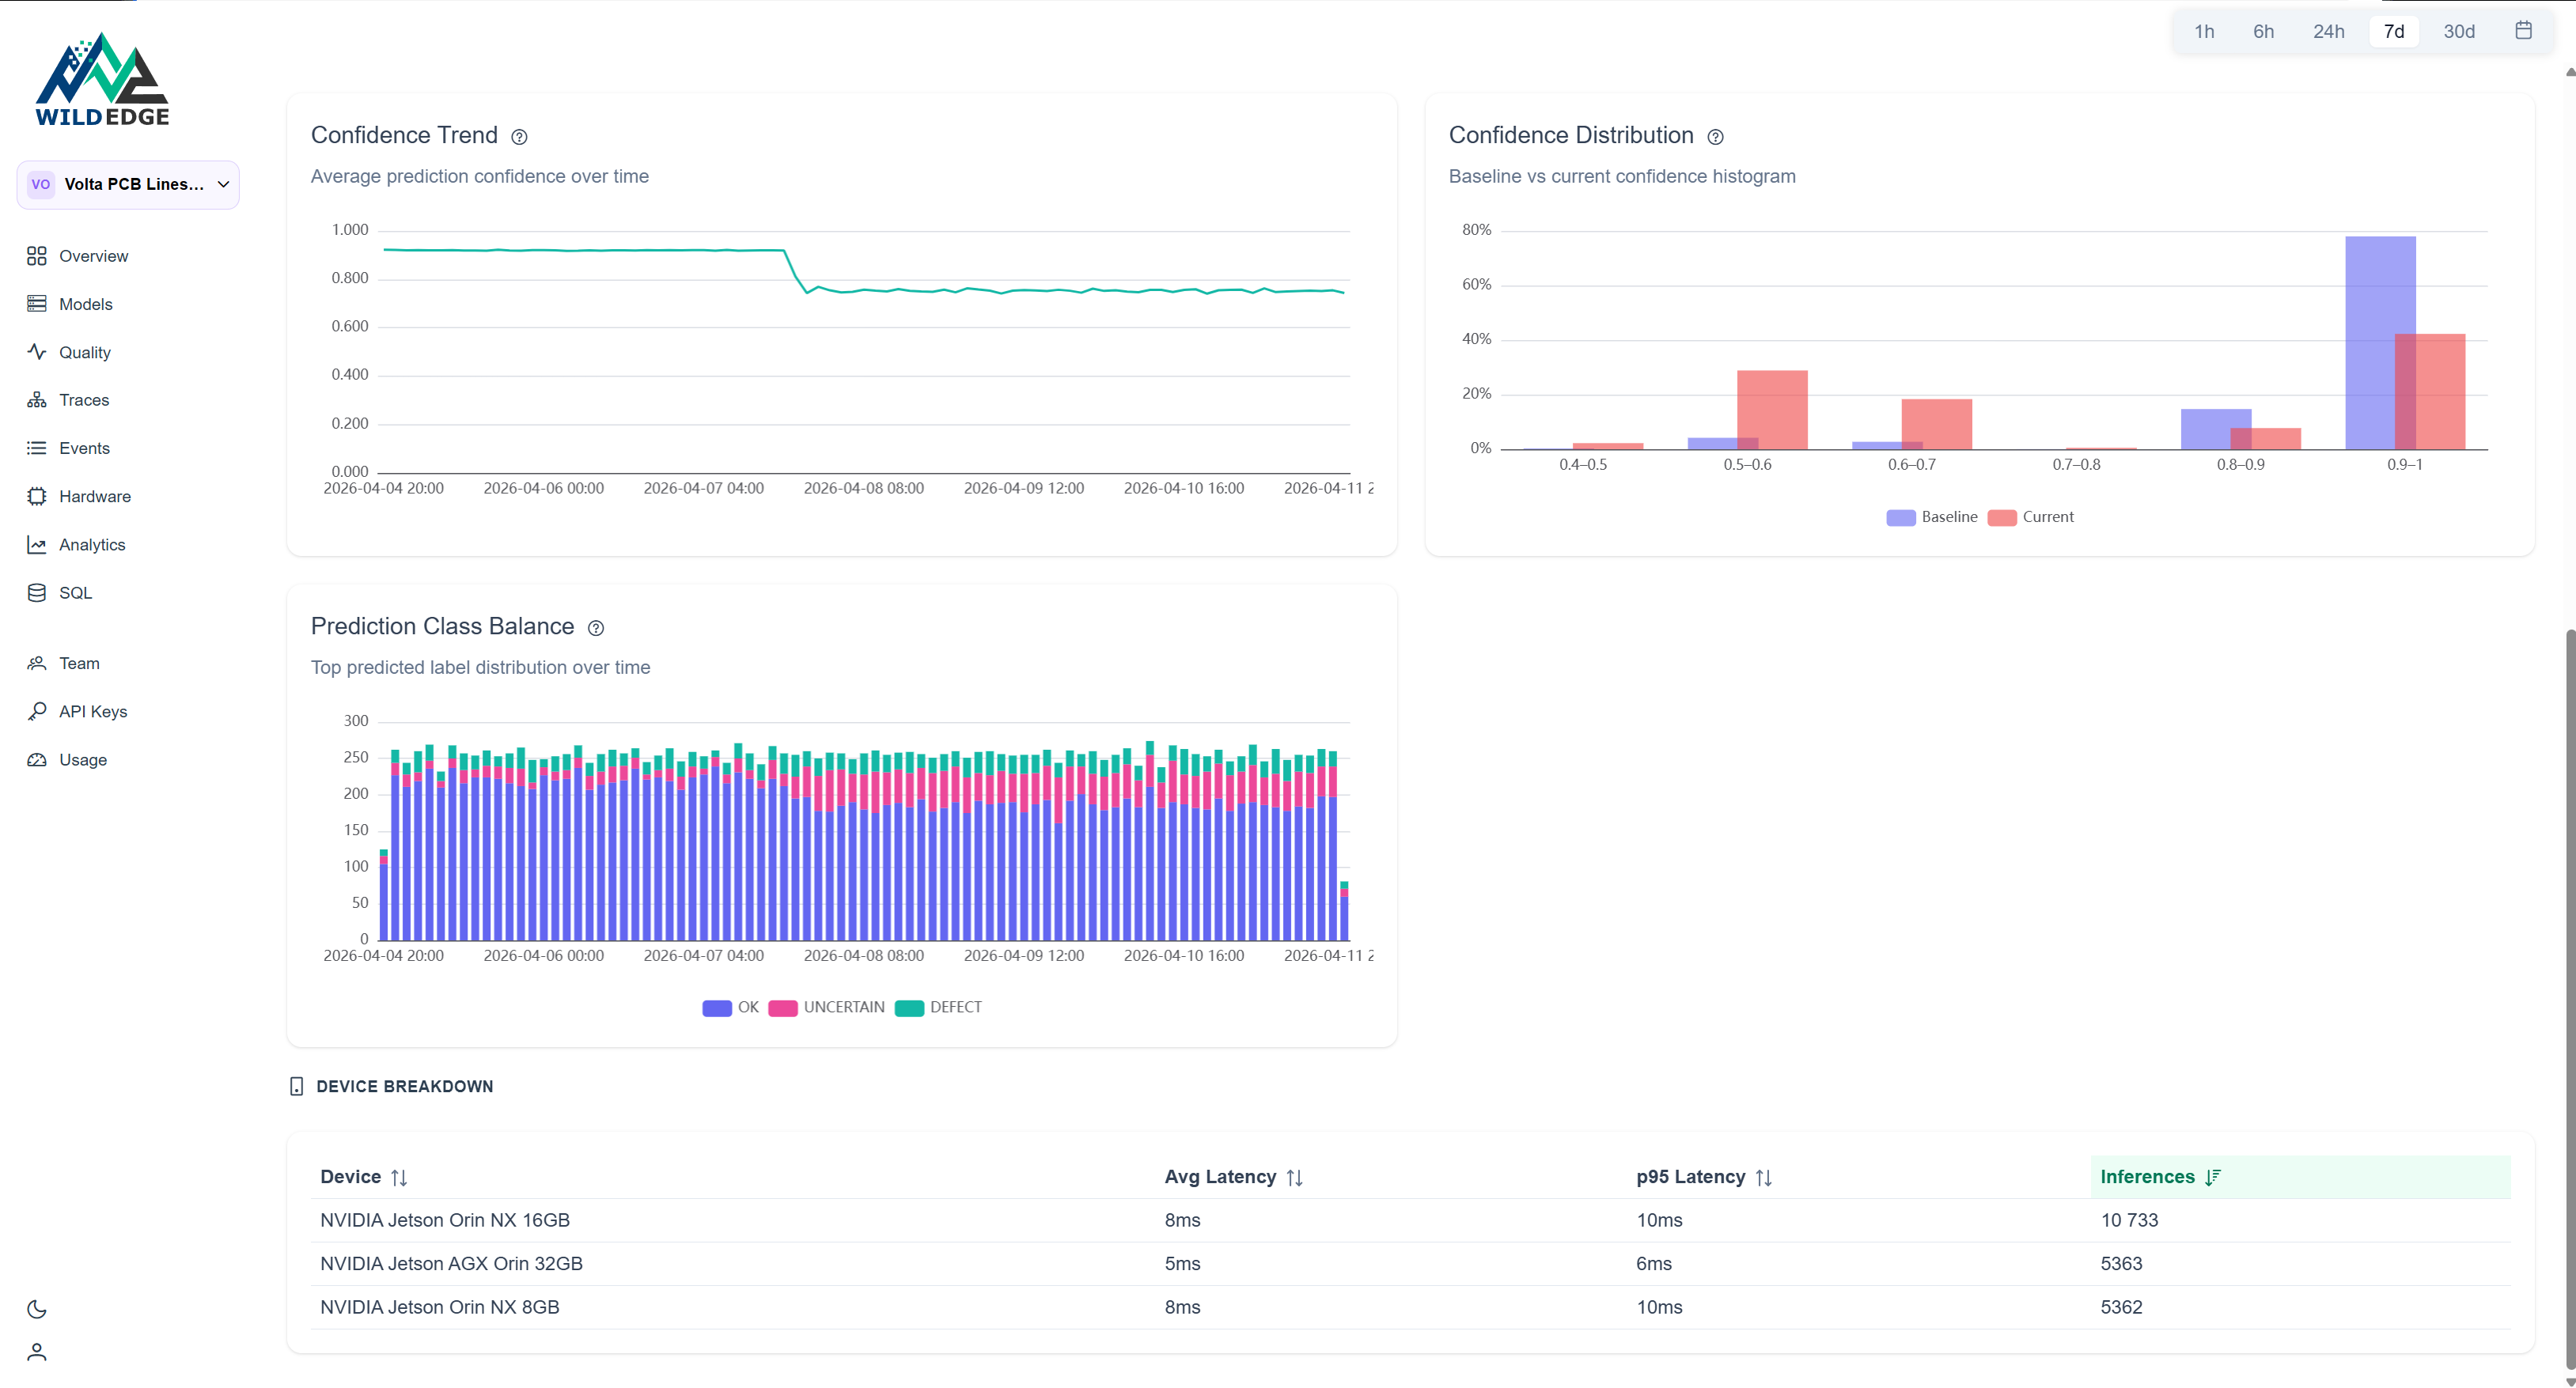
The Population Stability Index (PSI) score is 1.09, well past the 0.25 threshold that flags a model as Drifting. The confidence histogram makes it concrete:
In the baseline period, 78% of boards scored in the 0.9-1.0 bucket. In the current period that dropped to 42%, with 47% of boards now landing in the 0.5-0.7 range where previously there were almost none. The model isn't misclassifying. It's hedging. It sees something unfamiliar and won't commit.
The model hasn't gotten worse at detecting defects it knows. It's uncertain about boards it hasn't seen before.
The device breakdown
The devices page confirms all eight units are active, reporting the same OS, and have been sending events continuously since the deployment started.
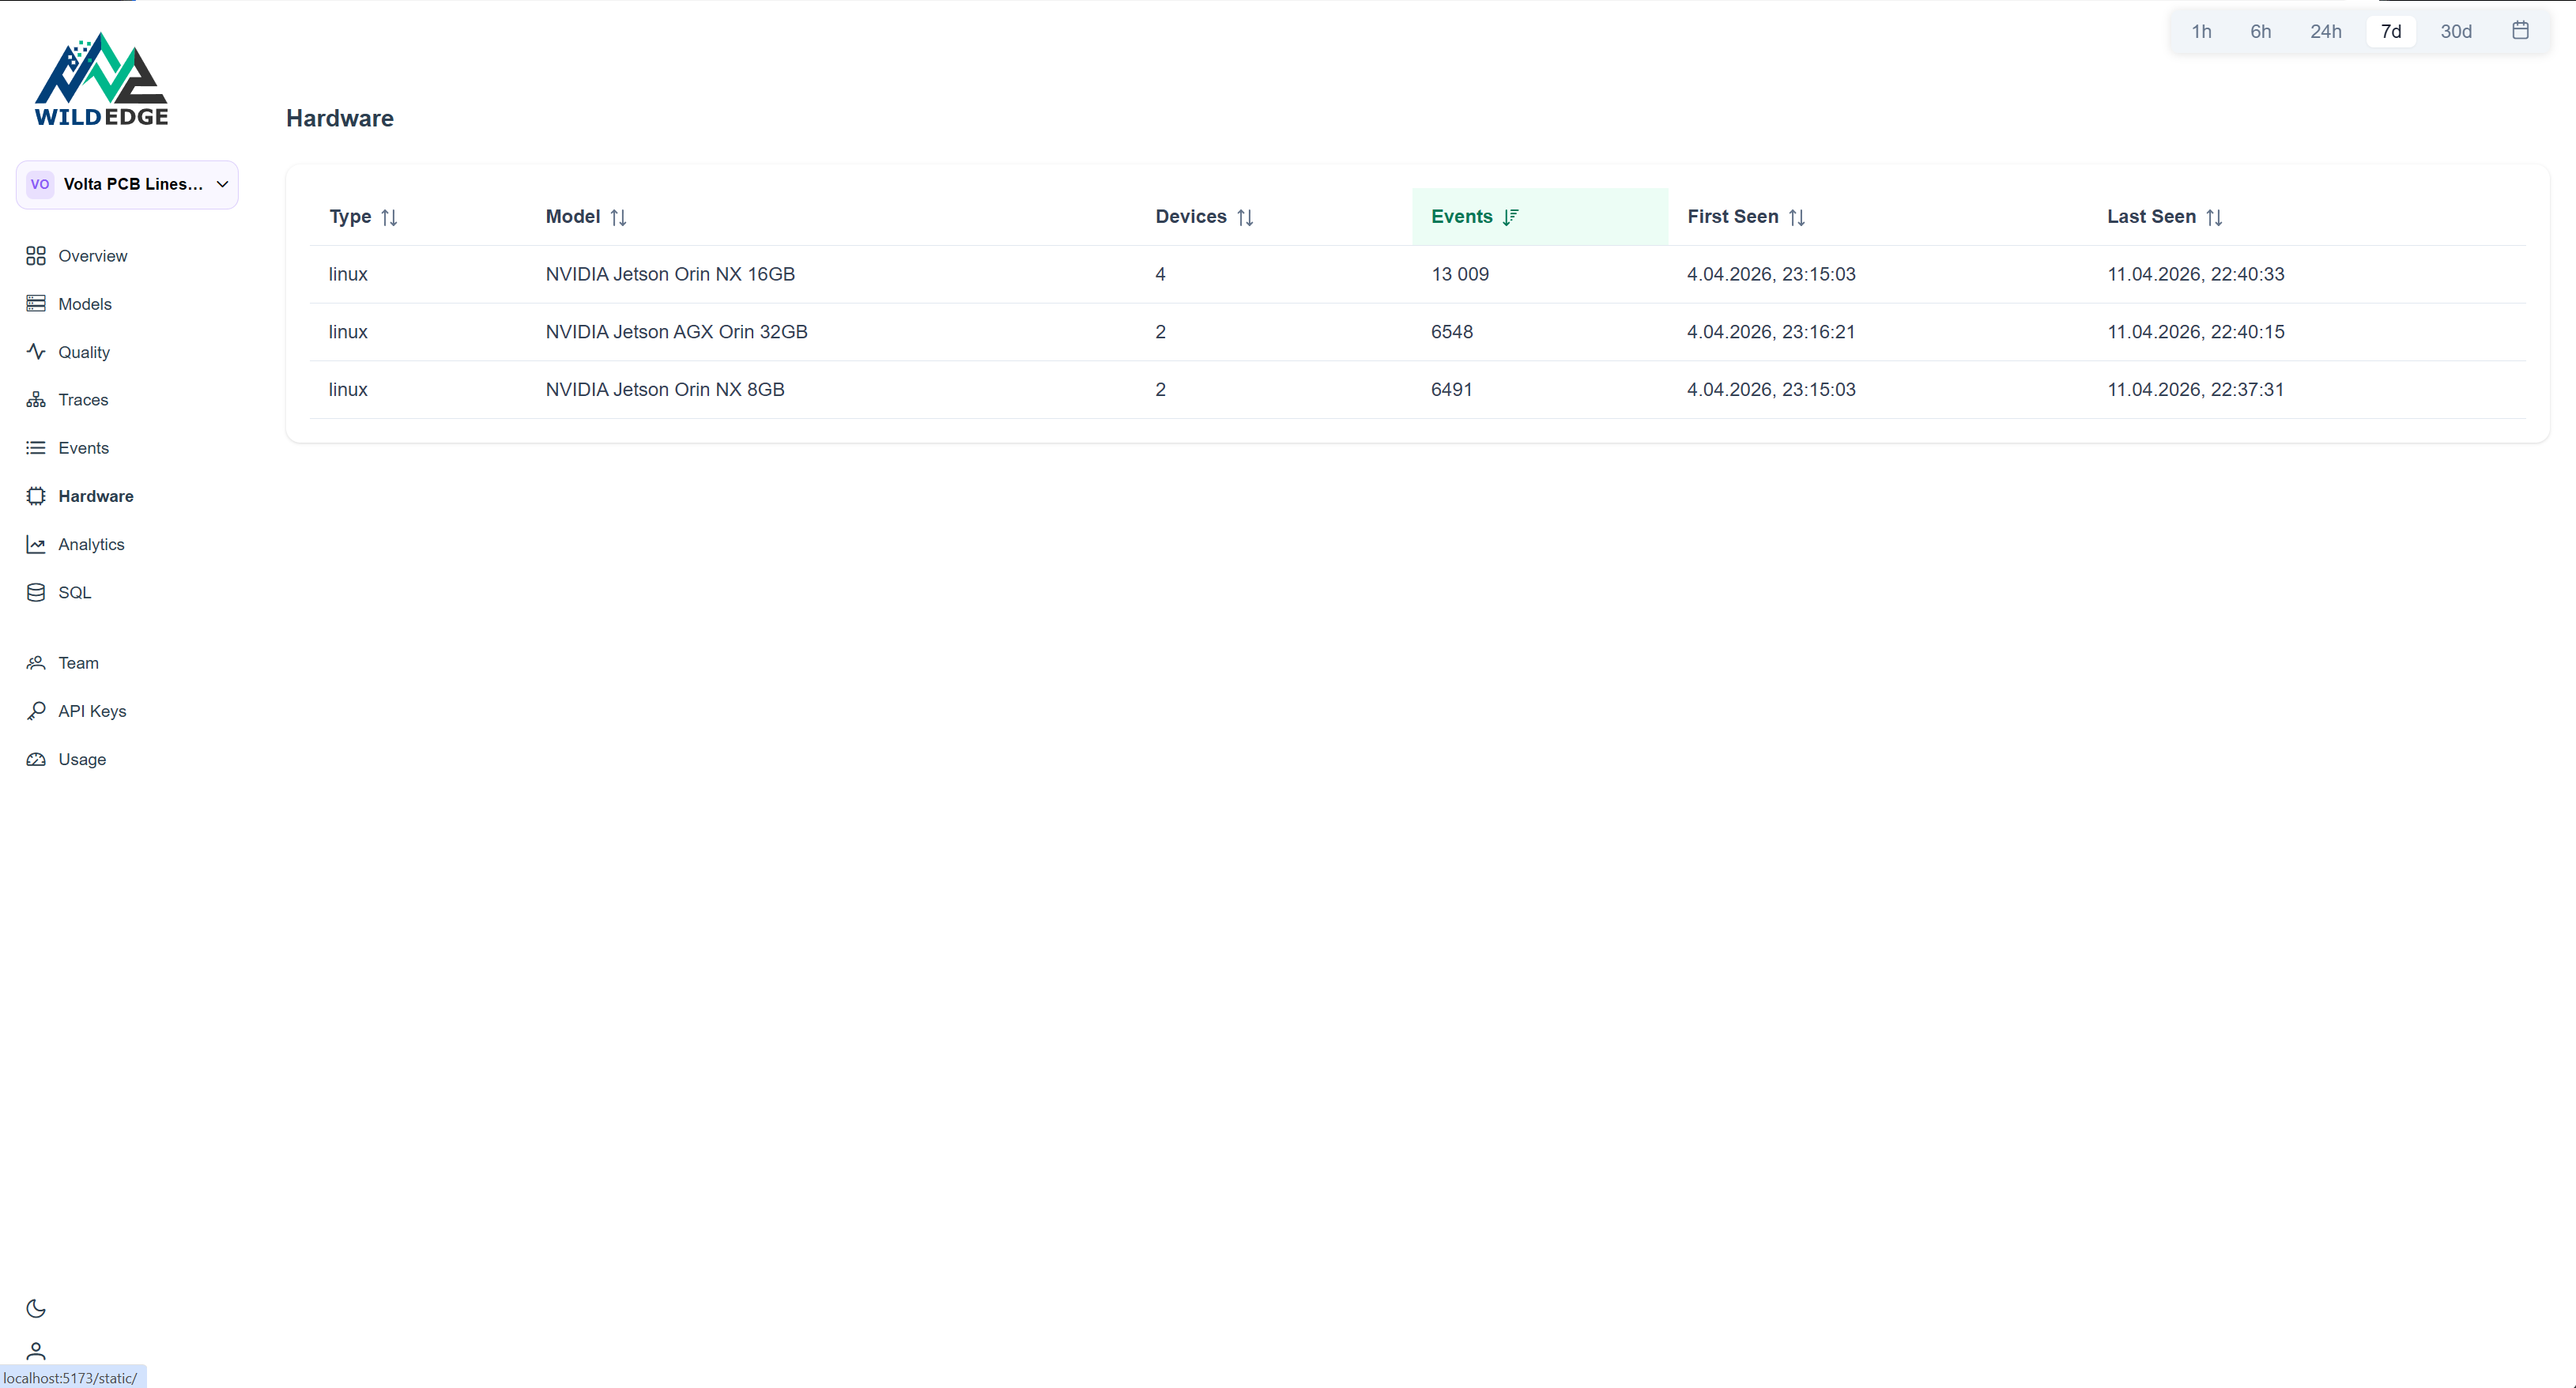
Nothing here points to a hardware problem. All units are alive, all reporting on schedule. The issue is not in the fleet. It's in what the fleet is looking at.
The cause
Volta pulled the production schedule. On day -4, Line B switched to a new board revision: rev B. Slightly different component layout, new heatsink pad positions, different silkscreen. The model had been trained exclusively on rev A boards collected over six months — it had never seen rev B.
Every rev B board looks subtly unfamiliar. Not wrong enough to call DEFECT, but wrong enough to land in UNCERTAIN at three times the normal rate:
| Baseline | After rev B | |
|---|---|---|
| Line A escalation rate | 13% | 14% |
| Line B escalation rate | 14% | 41% |
At roughly $0.0003 per escalation, four cameras, 420 inspections per hour, the cost difference is real. More importantly, at 41% UNCERTAIN you've lost most of the value of the automated line.
The GPT-4o-mini detail page adds a second read on the same event. Call volume spikes at day -4. Token usage and time-to-first-token (TTFT) stay flat throughout.
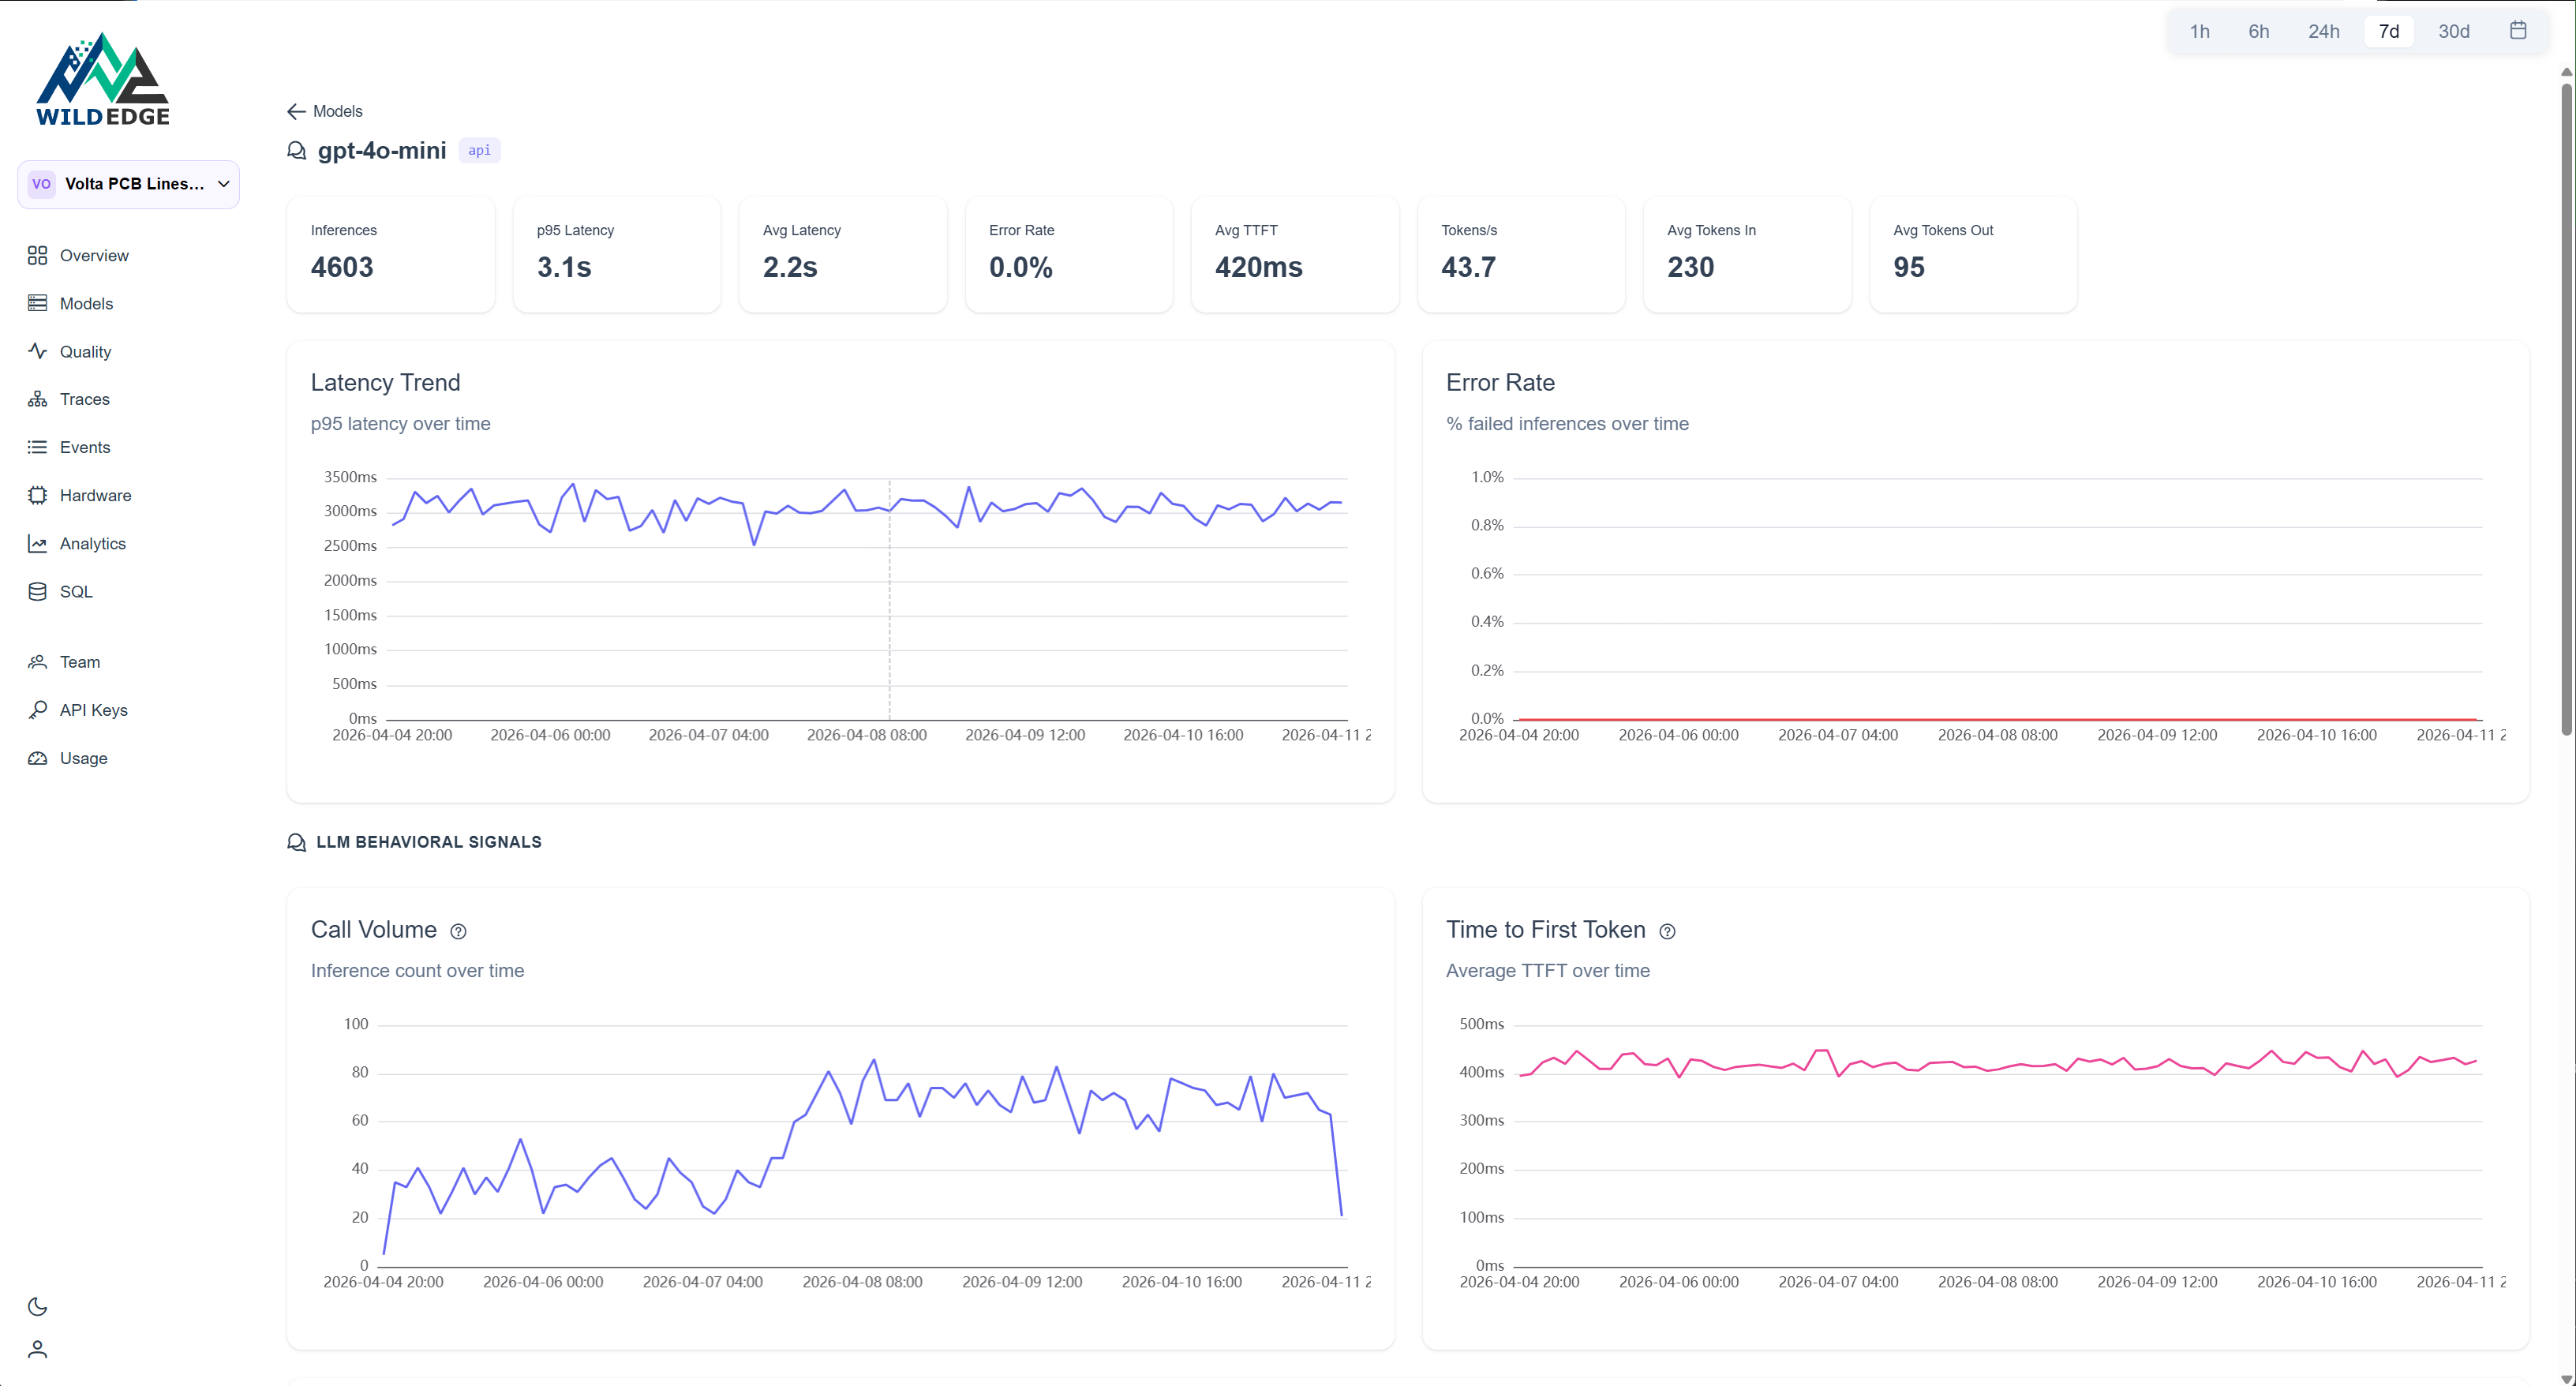
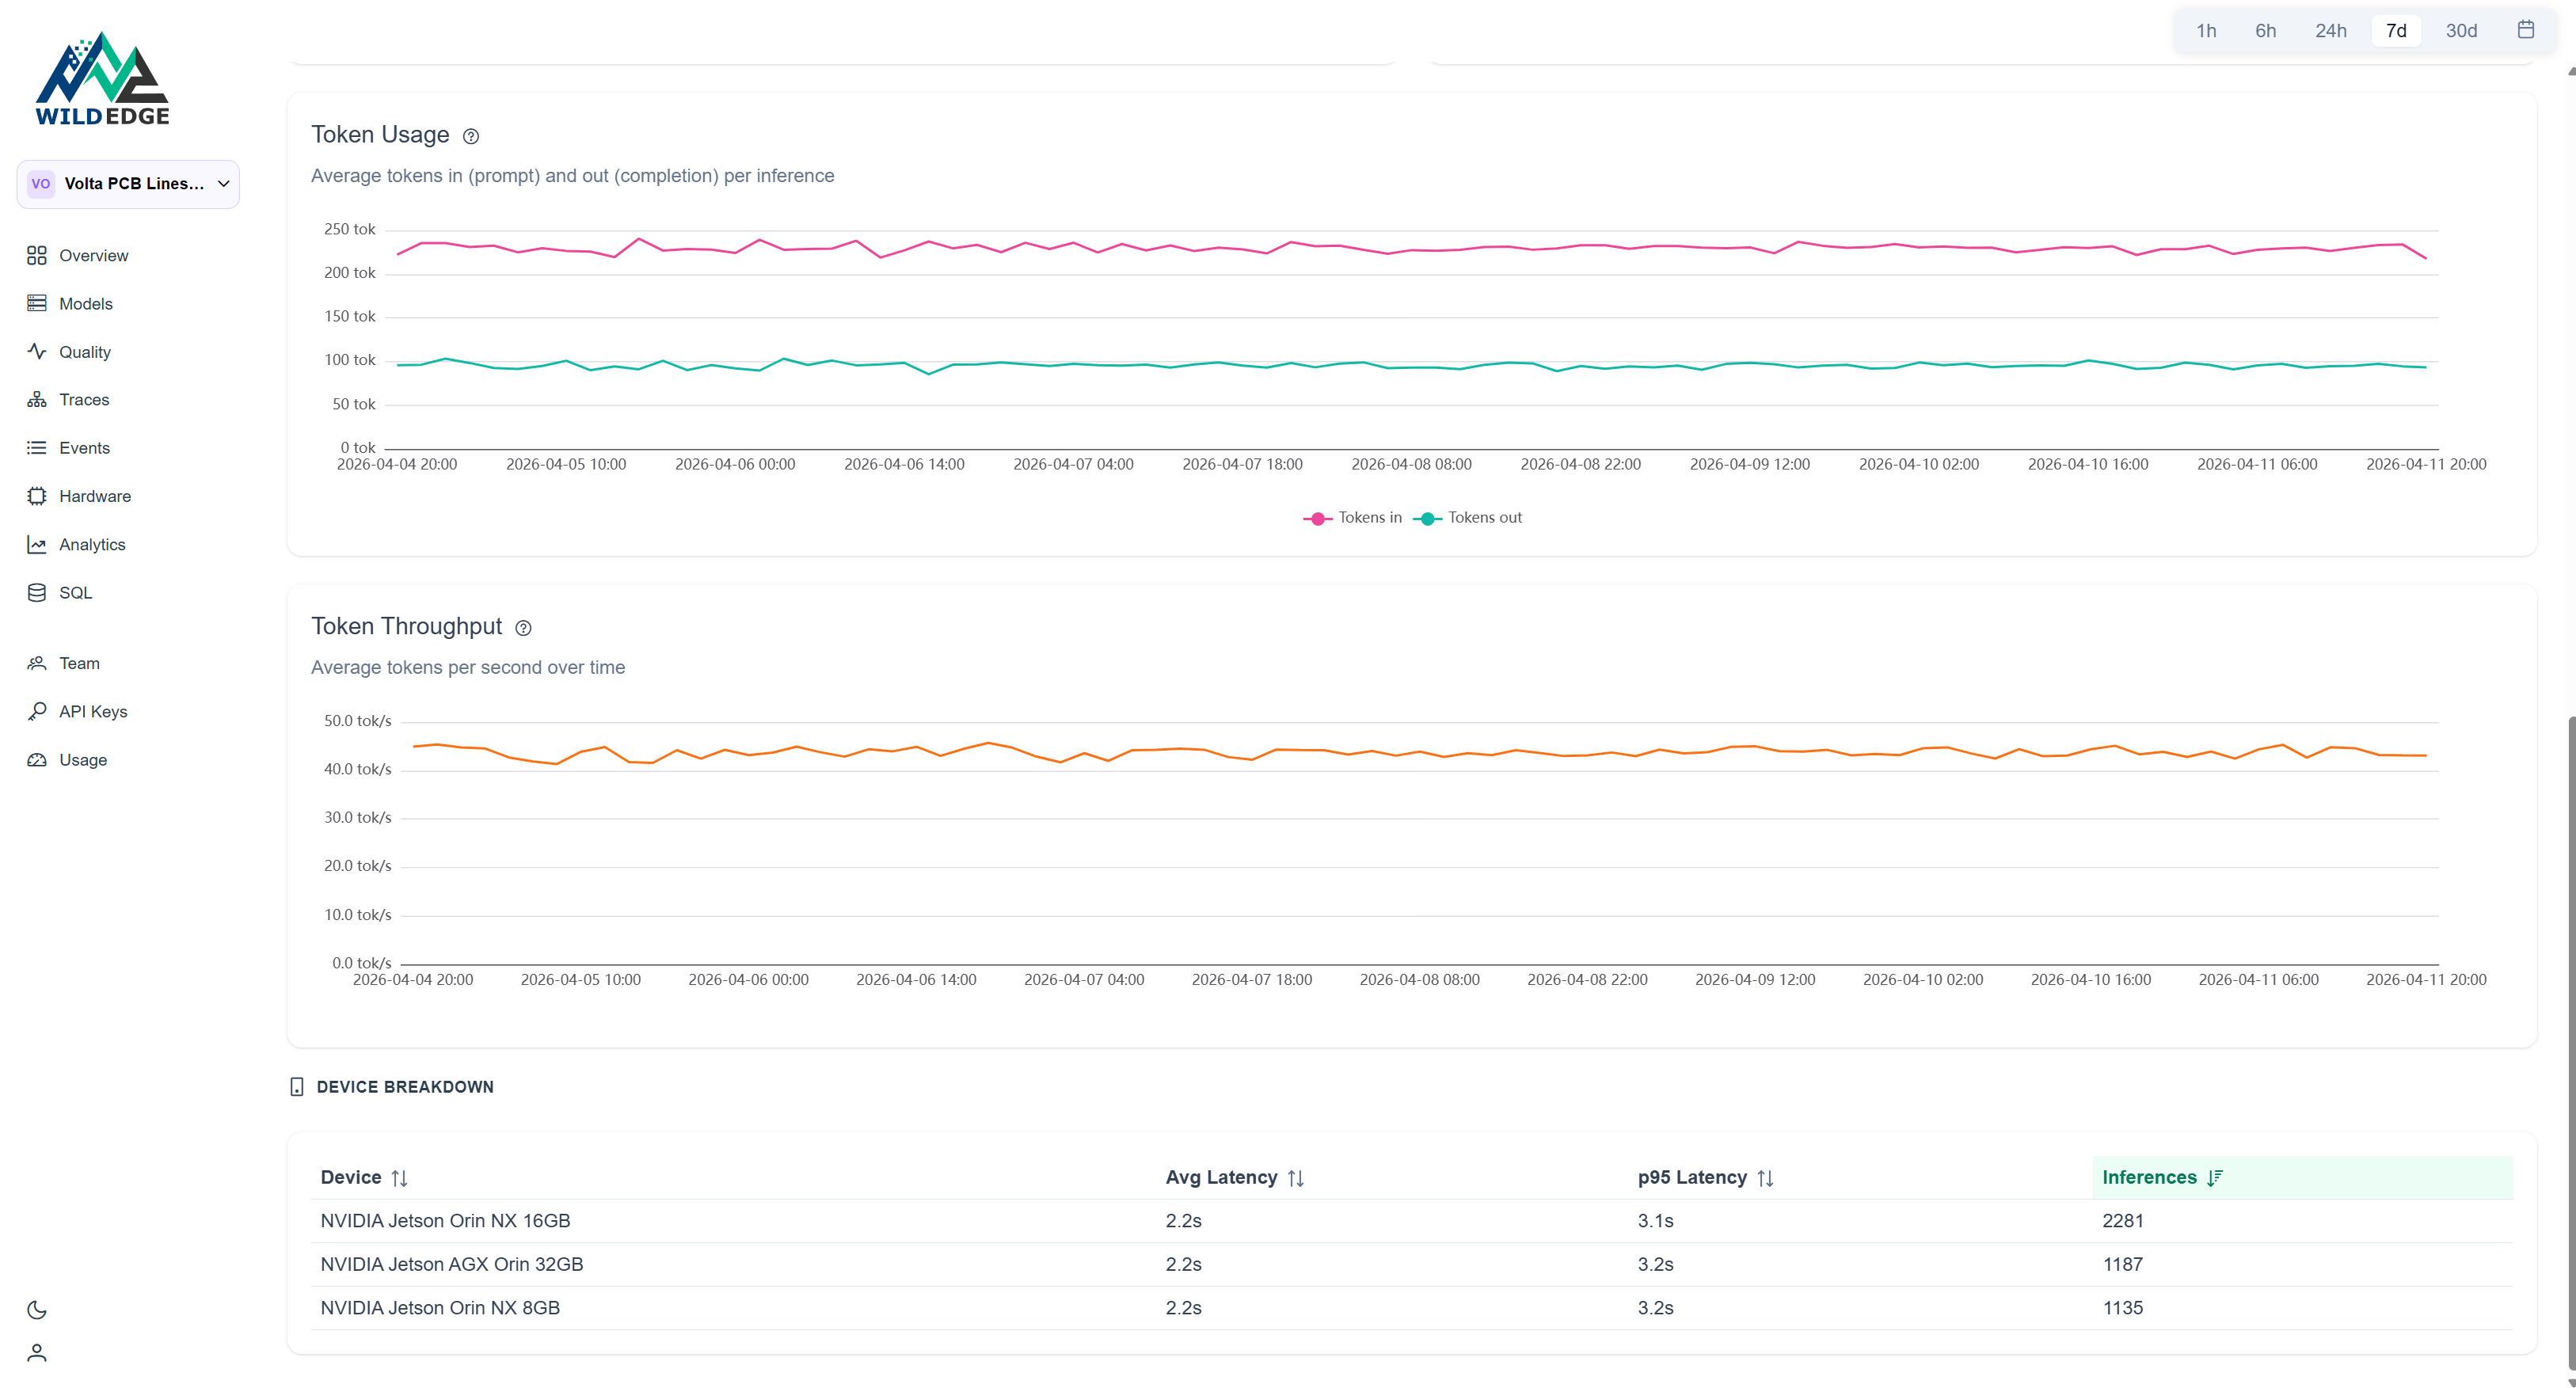
Flat tokens and flat TTFT mean the API is healthy. The spike is purely volume: the classifier is uncertain more often, so it escalates more often. The LLM is doing its job correctly, just three times as frequently.
What Volta did
Route all Line B boards to human review while collecting labeled rev B images. The GPT-4o-mini reports helped: every flagged board got a structured description of the same unfamiliar features, which told the team exactly what the model wasn't recognizing.
Two days later they had enough data to fine-tune. They staged the update to one Line B unit first, watched confidence recover, then rolled to the rest of Line B. Four days of elevated UNCERTAIN rates. No defective boards shipped. Without the monitoring, this would have surfaced as end-of-line QA failures or customer returns.
The model didn't error. Latency didn't change. GPU utilization was normal. Standard infrastructure monitoring would have shown eight healthy Jetson units right up until customers started returning boards. What caught this was model-level observability: confidence distributions tracked per device, compared against a baseline, and broken out by line. The device breakdown ruled out hardware in ten minutes. The PSI score told Volta the input distribution had shifted before anyone filed a bug. The GPT-4o-mini usage breakdown told them exactly what the model was struggling with. Each of those is a separate question: is it the hardware? is it the model? is it the data? WildEdge answers them in one place, in the order you'd actually ask them.
Set this up on your own line
The Python SDK instruments a wide variety of runtimes automatically via the wildedge run CLI wrapper. No code changes needed.
uv add wildedge-sdk

WILDEDGE_DSN=https://... wildedge run \
  --integrations onnx \
  -- python inspect.py
Your existing inference code runs unchanged:
import onnxruntime as ort

session = ort.InferenceSession("pcb-defect-detector.onnx")
outputs = session.run(None, {"input": frame})
# tracked automatically
The confidence trends, PSI scores, and device breakdown shown above are built from what the SDK captures without any additional instrumentation: per-inference latency, output confidence, top-k predictions, accelerator in use, and thermal state.
Volta Electronics is a fictional company. If your line looks like this, WildEdge can be running on it today.