
LLAMA - From Raw Counters to Product Telemetry
A guide to telemetry for an on-device LLM built with llama.
When a model runs on-device instead of behind an API, you lose the server logs you'd normally lean on: there's no central place to see that a load failed, that generation crawled to a halt, or that a device ran out of memory mid-response. Telemetry is how you get that visibility back: it tells you whether a model loaded successfully, how fast it actually generates on real hardware, and why a given generation stopped when it did. Concretely, that means capturing model load time, tokens per second, time to first token, and stop reason, broken down by device and by model, so you can see how your app actually behaves across the full range of hardware your users carry.
WildEdge provides actionable product telemetry by translating raw counters (milliseconds and tokens) into aggregated metrics, like throughput, time to first token, and failure rates, to reveal patterns across your entire user base instead of just one run.
What llama Knows
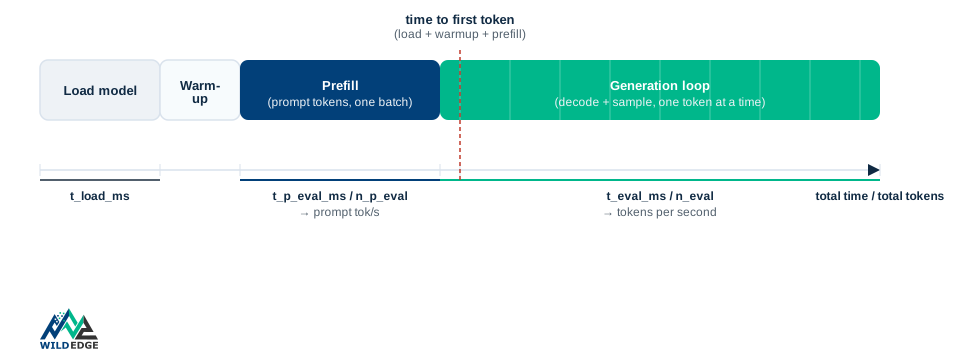
llama itself tracks a fair amount of performance data internally. llama_perf_context(ctx) returns a struct (llama_perf_context_data) with fields like t_load_ms, t_p_eval_ms (prompt/prefill time), t_eval_ms (time spent generating), and token counts for both phases. Here's how those phases line up on an actual timeline, from loading the model to the last generated token:
What You Need to Know
Here's what each field in the struct actually means:
struct llama_perf_context_data {
    double t_start_ms;  // absolute start time
    double t_load_ms;   // time needed for loading the model
    double t_p_eval_ms; // time needed for processing the prompt (prefill)
    double t_eval_ms;   // time needed for generating tokens

    int32_t n_p_eval;   // number of prompt tokens
    int32_t n_eval;     // number of generated tokens
    int32_t n_reused;   // number of times a ggml compute graph was reused
};
Source: llama_perf_context_data in llama.h
t_start_ms: when the context was created, as an absolute timestamp. Mostly useful as a reference point rather than a duration.t_load_ms: wall-clock time spent loading the model, fromload timein the printed log.t_p_eval_ms/n_p_eval: total time and token count for the prefill (prompt) pass. Divide the two forprompt eval time ... ms per token.t_eval_ms/n_eval: total time and token count for the generation loop. Divide the two foreval time ... ms per token, the number that becomestokensPerSecond.n_reused: how many times llama.cpp reused a compute graph instead of rebuilding it (graphs reusedin the log). A low number relative ton_evalcan point to unnecessary graph rebuilds hurting throughput.
llama_perf_sampler_data Struct
There's also a sampler-level equivalent to llama_perf_context, llama_perf_sampler(smpl), which reports how much time was spent in sampling versus decoding, useful when a slow generation turns out to be an expensive sampling strategy (like high top_k) rather than the model itself:
struct llama_perf_sampler_data {
    double t_sample_ms; // time needed for sampling in ms

    int32_t n_sample;   // number of sampled tokens
};
Source: llama_perf_sampler_data in llama.h
t_sample_ms: total time spent inside the sampler chain (top-k, top-p, temperature, distribution, etc.) across all sampled tokens.n_sample: number of tokens the sampler chain actually produced. Dividet_sample_msbyn_sampleto get per-token sampling cost, and compare it againstt_eval_ms / n_evalfromllama_perf_context_data. If sampling time is a large fraction of eval time, the sampler chain (not the model) is the bottleneck.
Note this only works for samplers built via llama_sampler_chain_init, which is how llamaExample constructs its top-k/top-p/temperature/dist chain.
Dumping Perf Stats
All of this is counted automatically as decoding happens, and calling llama_perf_context_print(ctx) dumps it straight to stderr for quick local debugging:
llama_perf_context_print:        load time =    2730.60 ms
llama_perf_context_print: prompt eval time =    2322.08 ms /    10 tokens (  232.21 ms per token,     4.31 tokens per second)
llama_perf_context_print:        eval time =    3489.55 ms /   154 runs   (   22.66 ms per token,    44.13 tokens per second)
llama_perf_context_print:       total time =    6286.76 ms /   164 tokens
llama_perf_context_print:    graphs reused =        153
Closing the Gap with WildEdge
These numbers only exist for a single run on a single device, though: they don't persist, and they don't tell you anything about the other devices your app is running on. The work of building real product telemetry is mostly translating these raw counters (milliseconds and token counts) into the metrics that matter for a specific app: throughput, time to first token, and failure rate across real devices, aggregated so you can see patterns across your entire user base instead of one run at a time.
llama_perf_context_data and llama_perf_sampler_data give you the raw numbers for a single run on a single device. What you actually need is those same numbers, from every run, on every device your users carry, joined with the chip, RAM, and OS behind each one. That's exactly what WildEdge is built to do: wrap these counters into structured events, tag them with machine performance data automatically, and give you a queryable view across your whole install base instead of a printout you have to read one line at a time.
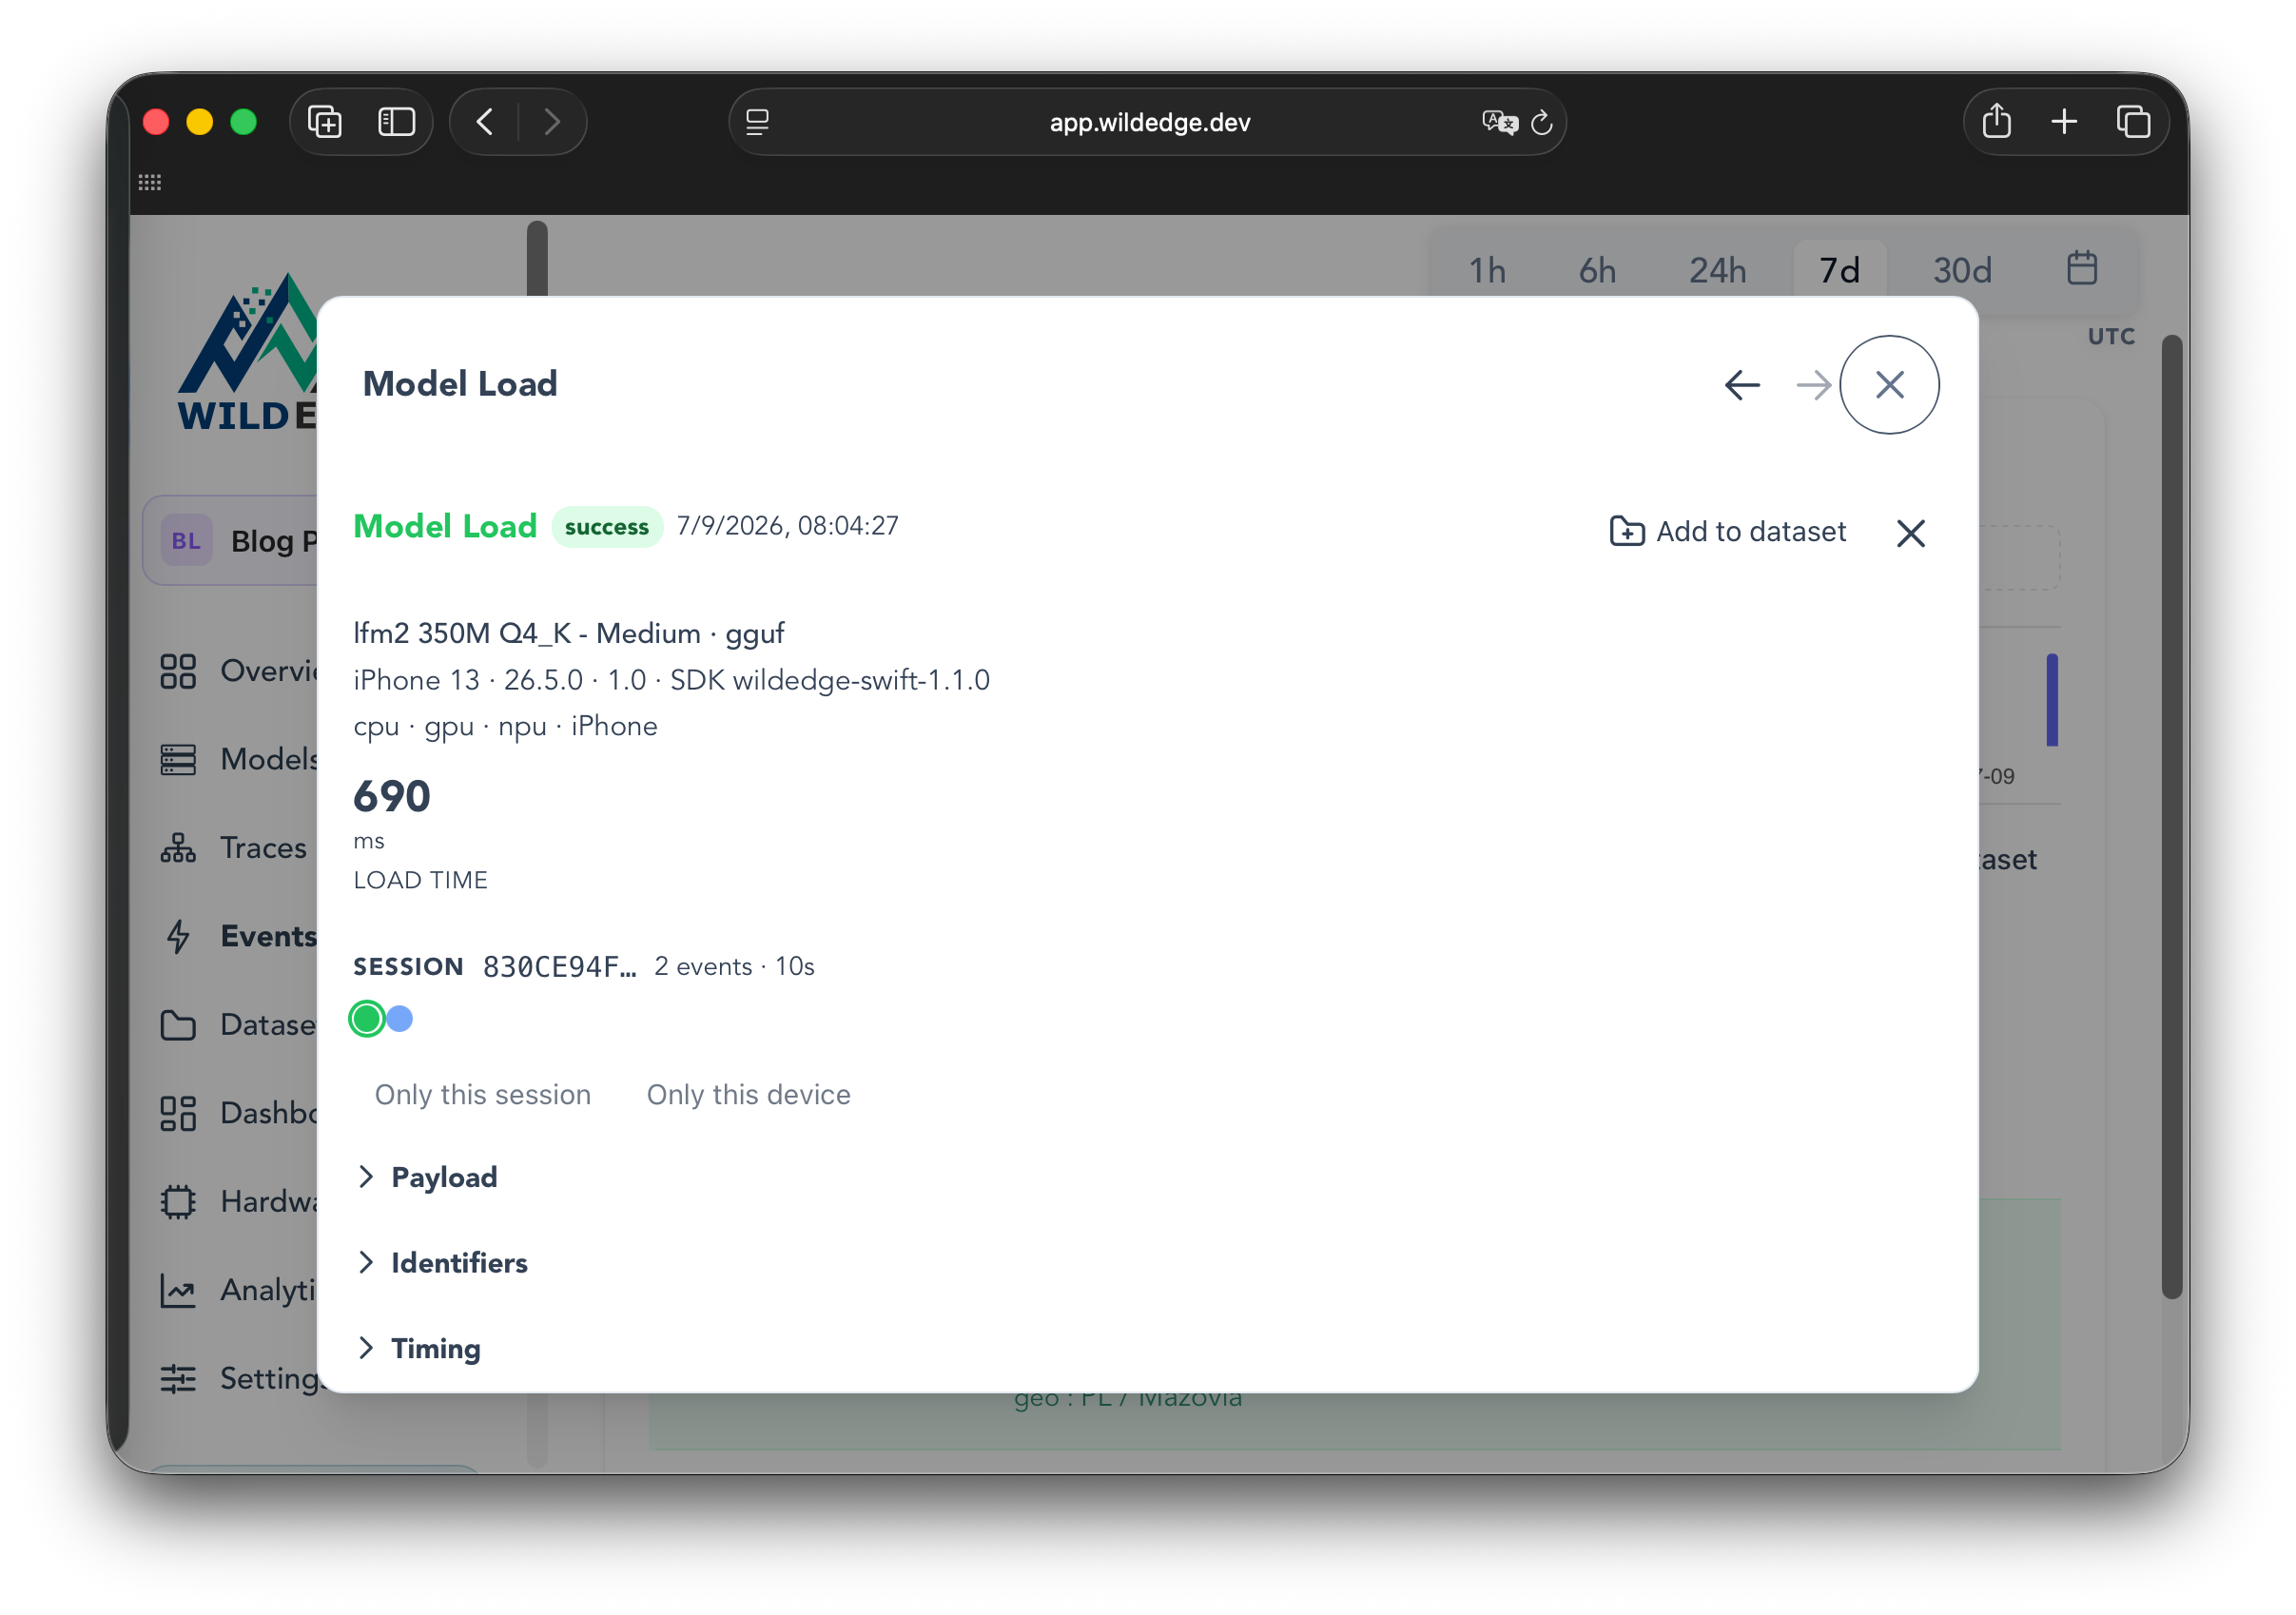
Here's what that looks like once the SDK captures it. A t_load_ms reading turns into a Model Load event, tagged with the device, OS, and SDK version it came from:
And the generation loop, t_eval_ms/n_eval and time to first token, becomes an Inference event with duration, throughput, and TTFT broken out as queryable fields:
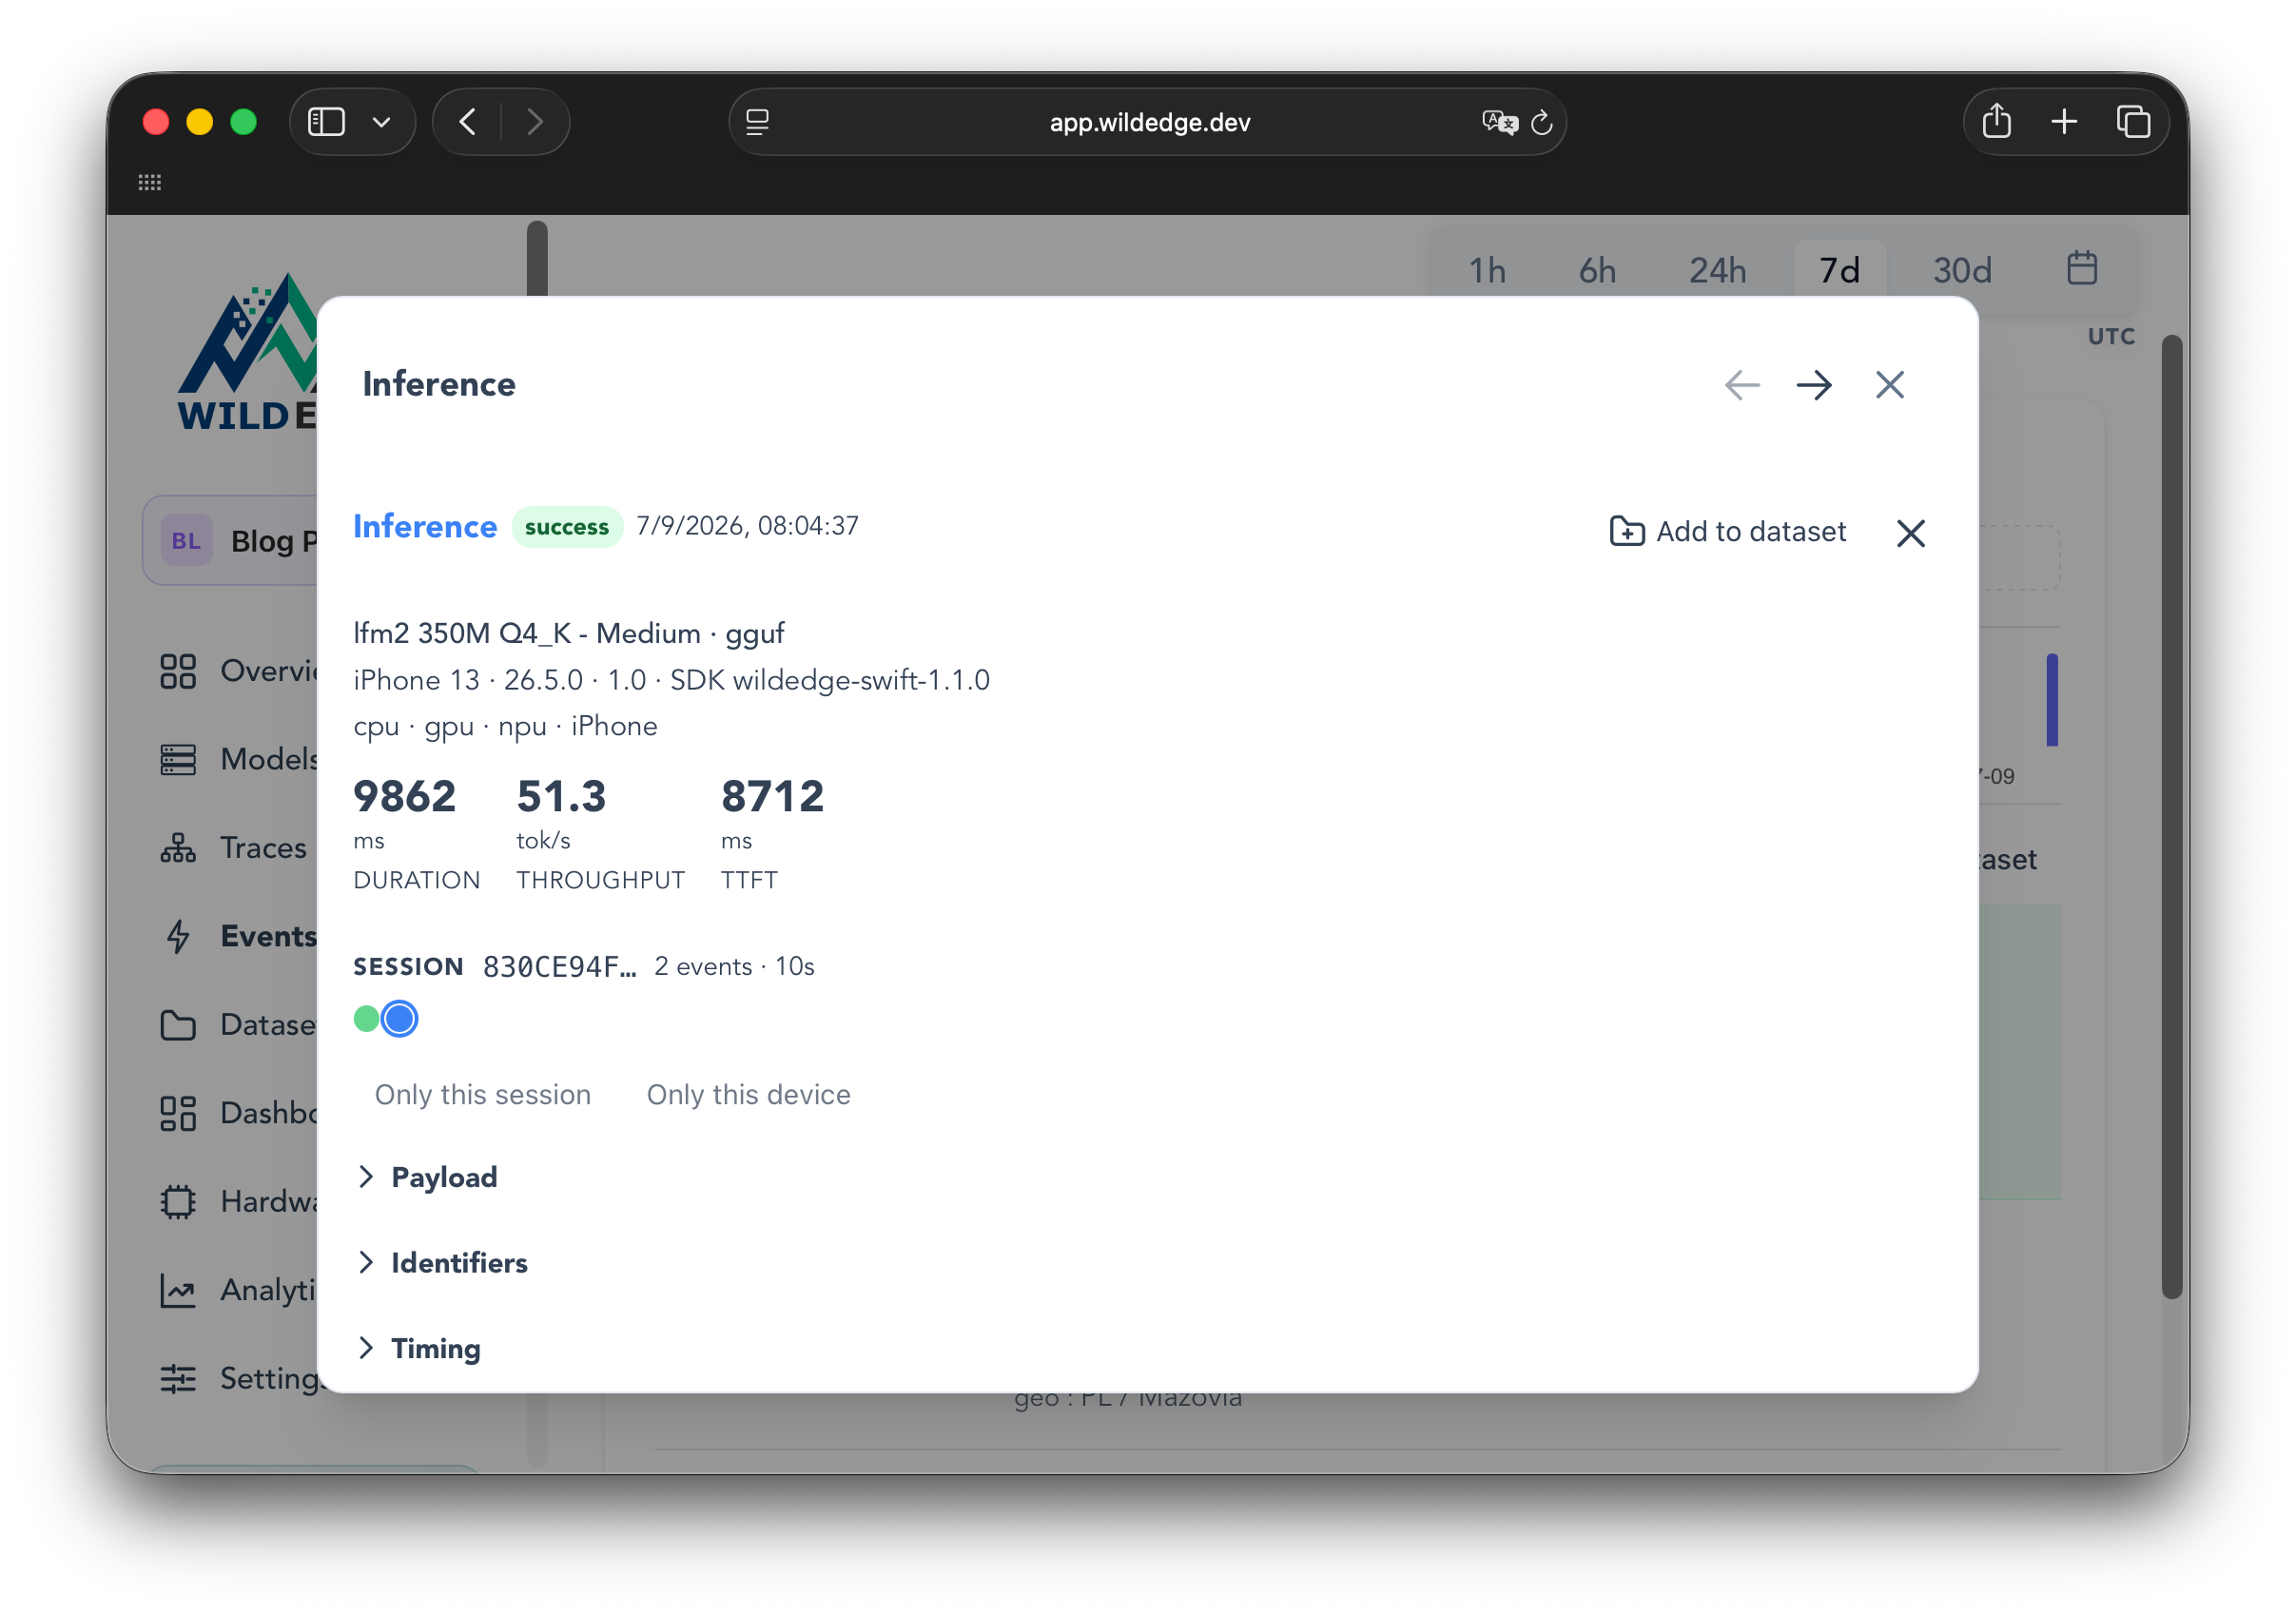
Both events are linked to the same session, so you can trace load time and generation performance back to the same run on the same device, then compare that against every other run in your fleet.
Individual events are the starting point, not the destination. Once enough of them land, WildEdge rolls them up into dashboards: p95 and average latency, error rate, and drift signals like confidence trend and distribution, tracked over time instead of read off a single stderr dump:
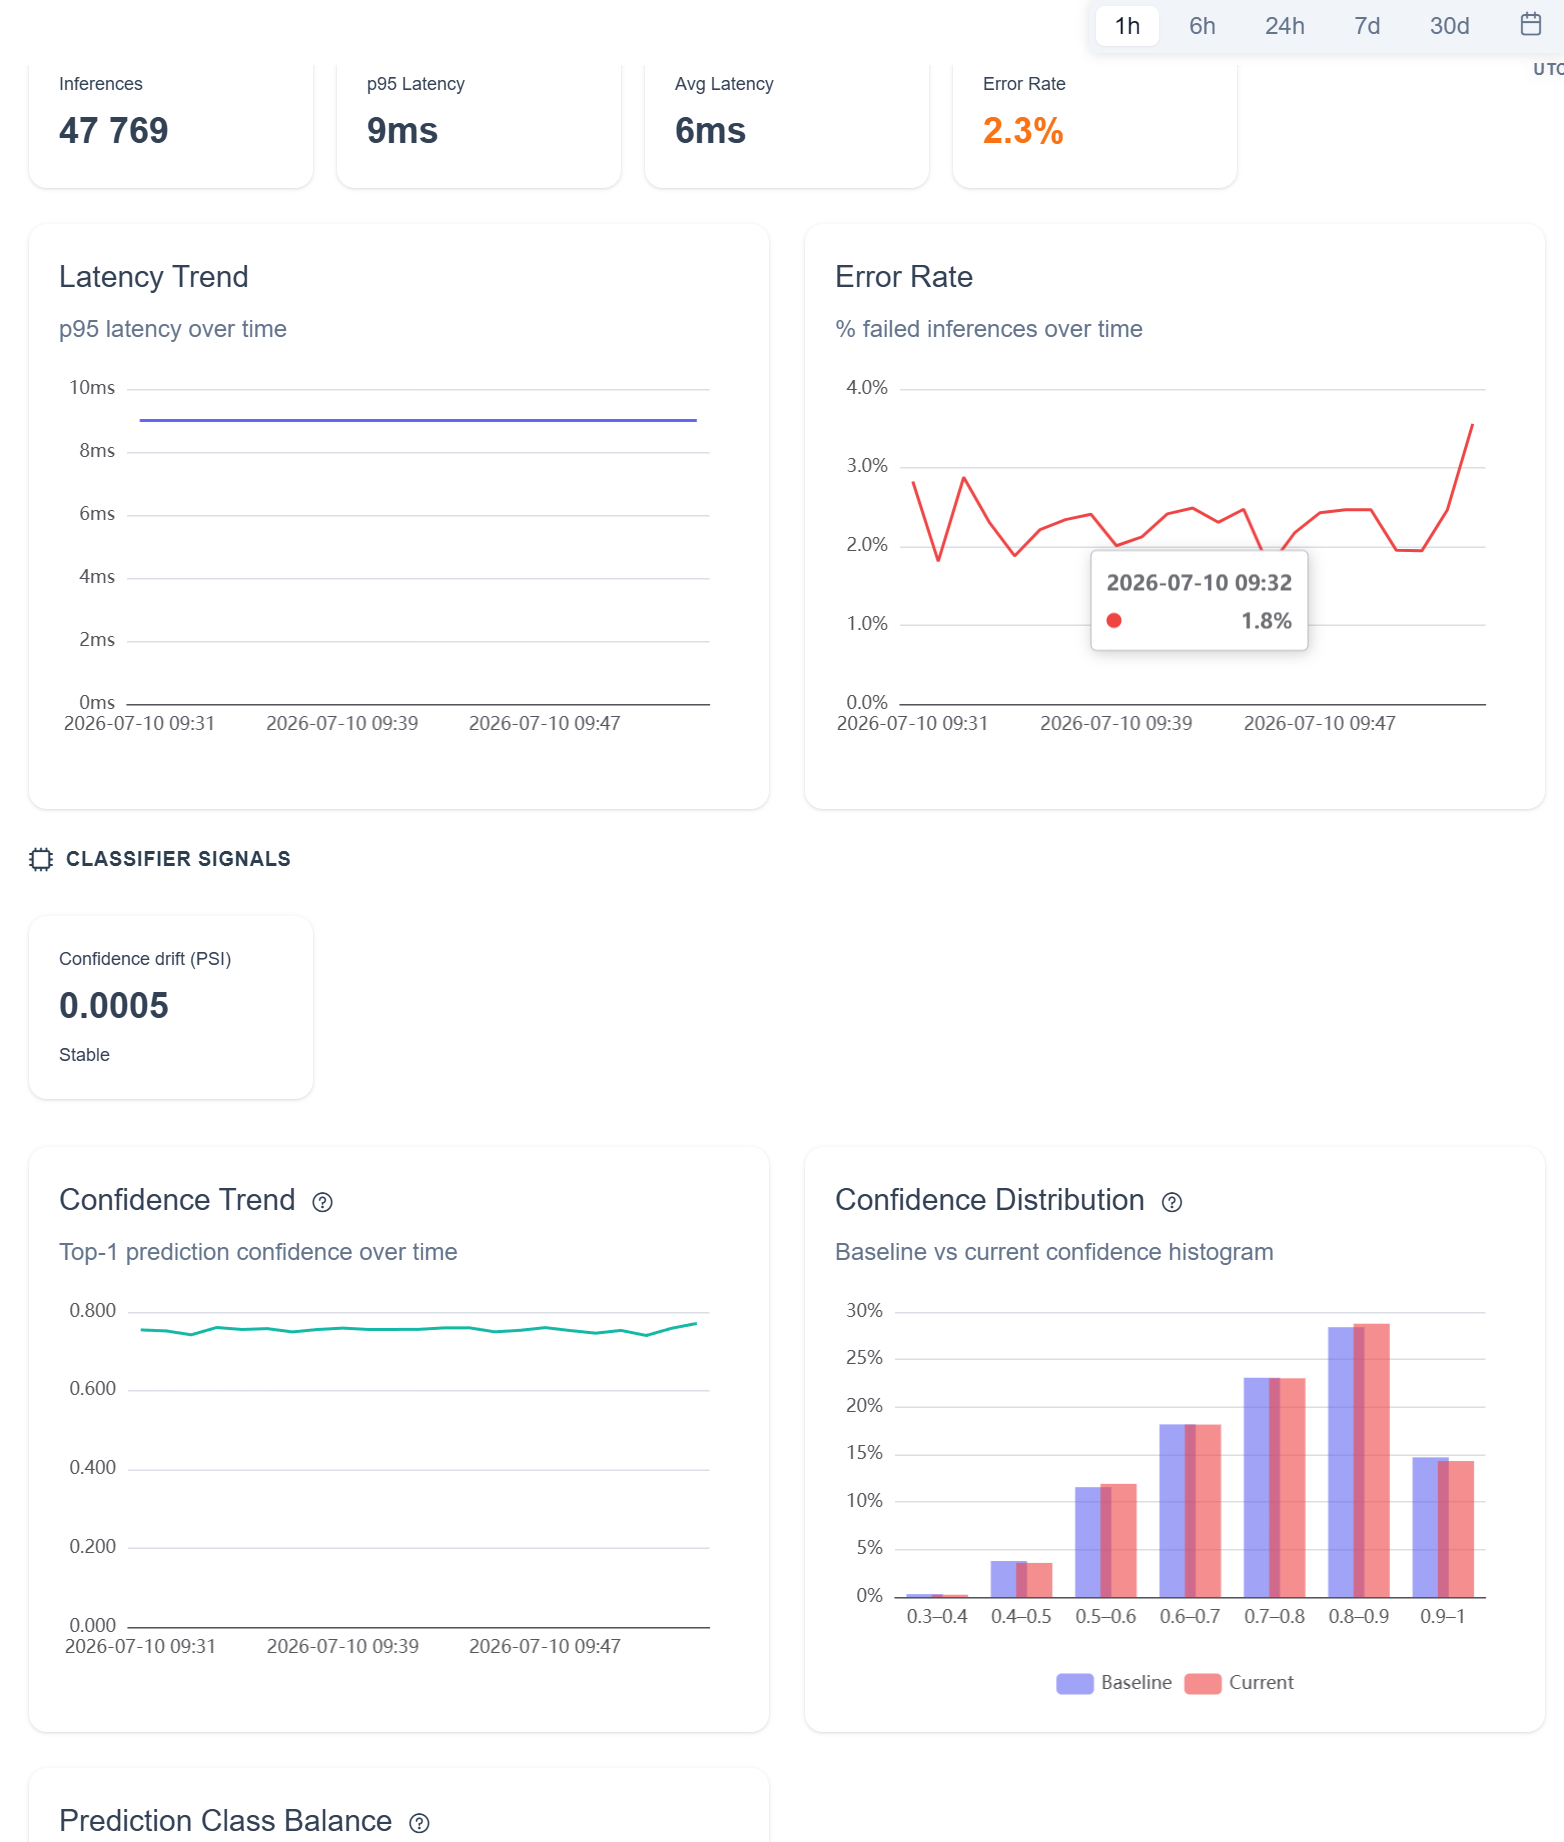
And because every event is just a row in a table, you're not limited to the built-in panels. The same p95 latency shown above can be broken down by device model with a few lines of SQL, straight against the events table:
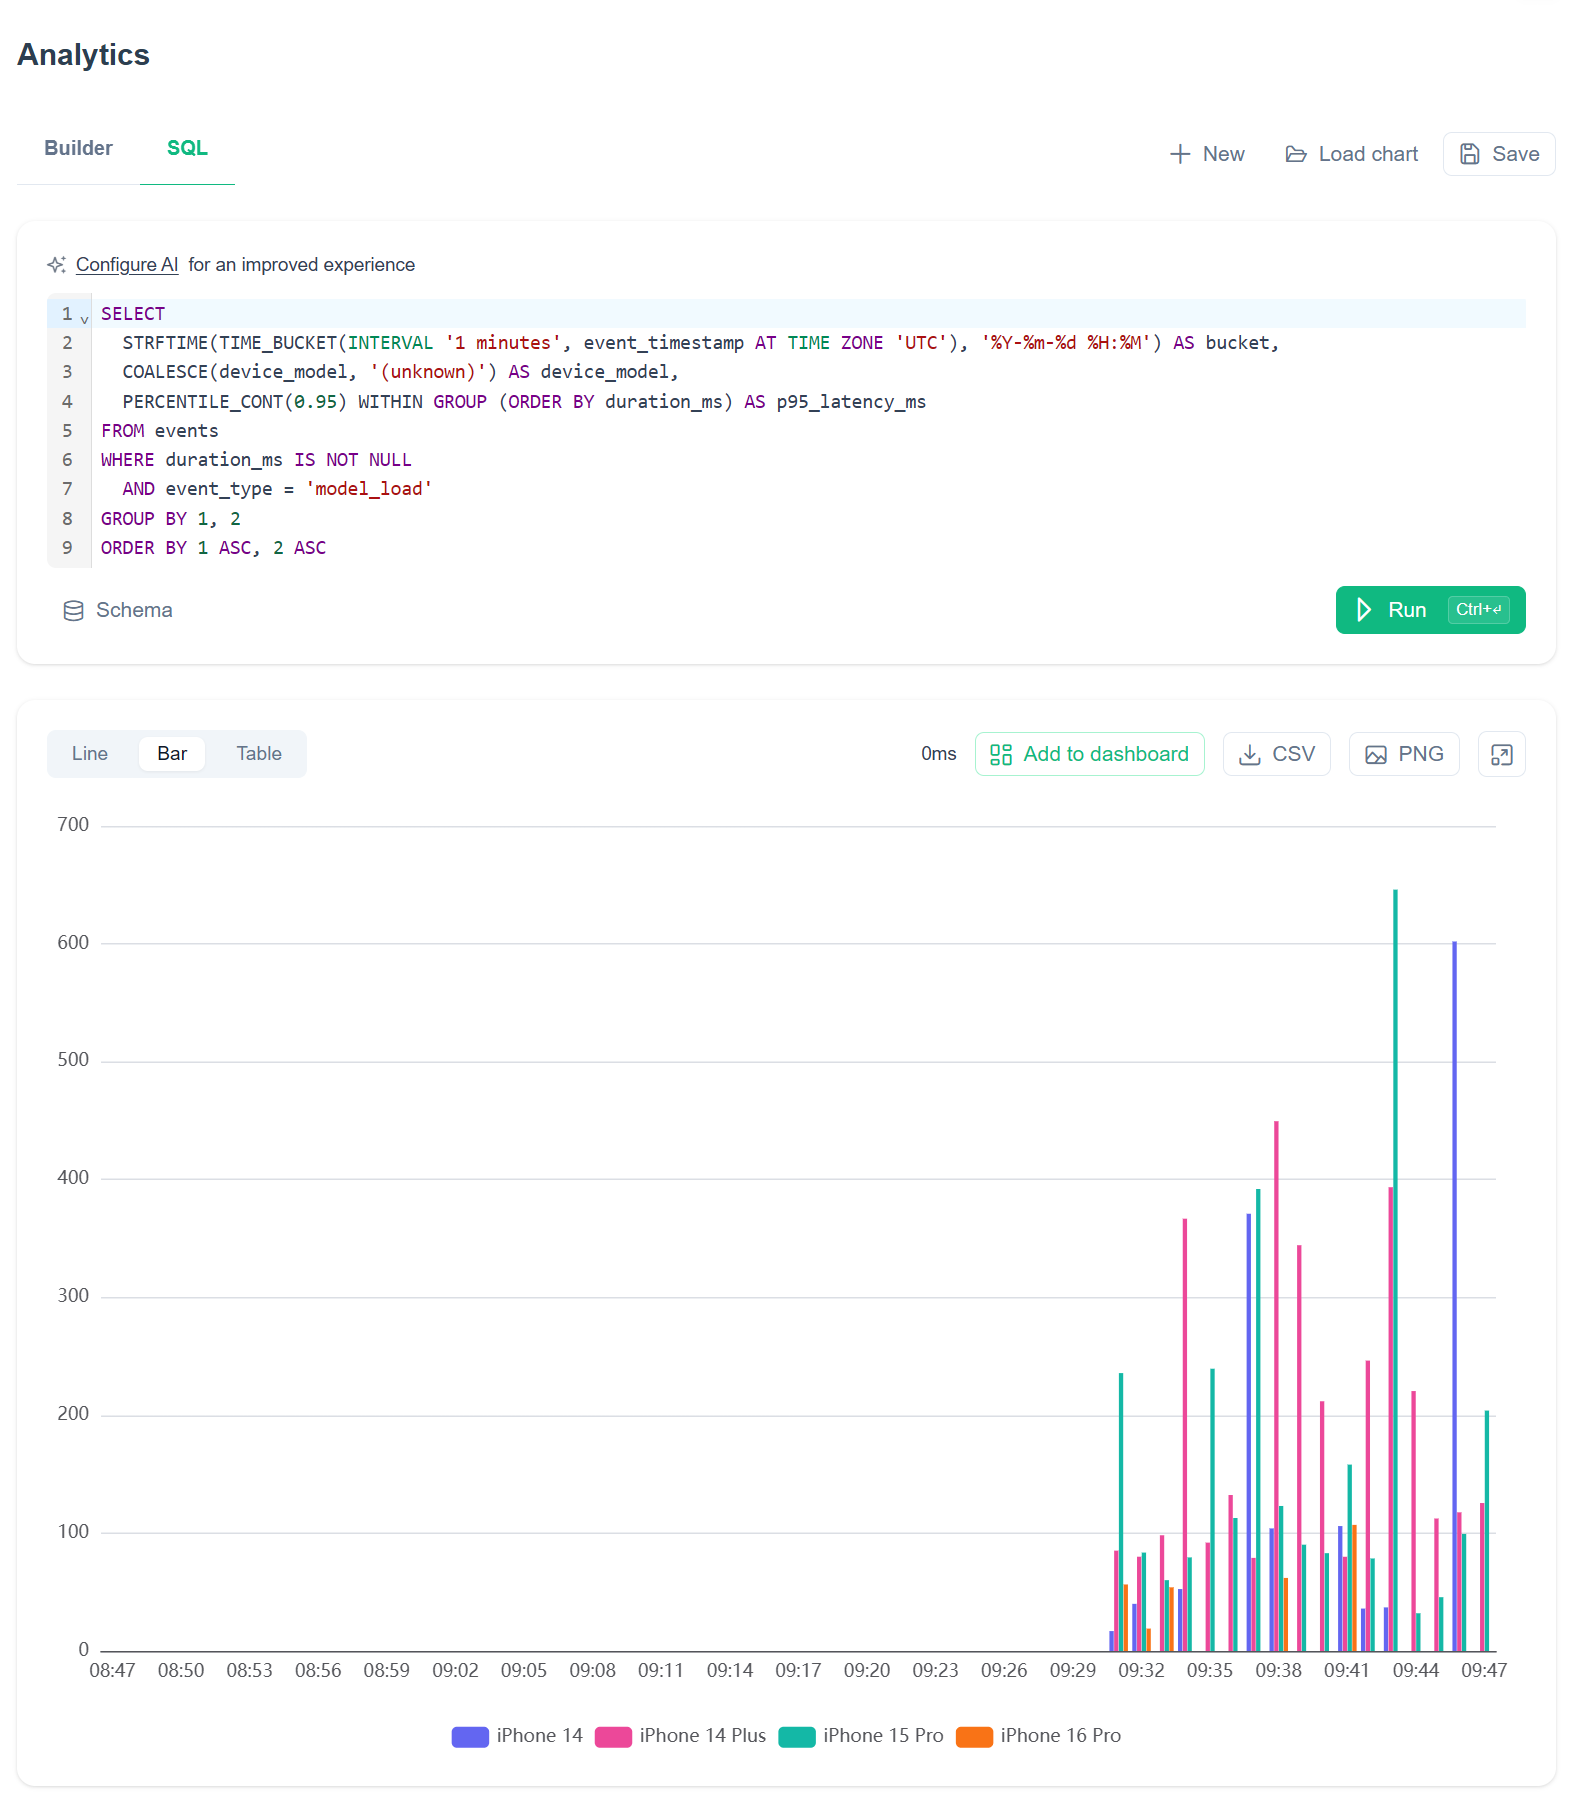
That's the difference between a printout and a queryable dataset: t_load_ms and t_eval_ms stop being numbers you eyeball per run and become a table you can slice by device, OS version, or model variant to find out, for example, that load time on an iPhone 14 looks nothing like load time on an iPhone 16 Pro.
If you want to see this working end-to-end rather than piecing it together from snippets, the llamaExample app in this repo wires up everything covered here (model loading, the generation loop, and WildEdge instrumentation) in a small, runnable Swift project. Clone it, point it at a GGUF model, and the telemetry described in this post is already flowing.
Links
- llamaExample: the full runner, WildEdge instrumentation, and model catalog referenced in this post.
- wildedge-swift SDK: the repo this example lives in, alongside examples for TFLite, ONNX, Gemini, and CarScanner.
- wildedge.dev: sign up and instrument your first on-device model in minutes.
- github.com/wild-edge: all WildEdge SDKs, open source.
- llama.cpp: the on-device inference engine this post is built on.
Check us out!
Sign up at wildedge.dev and instrument your first model in minutes. The SDKs are open source: github.com/wild-edge.
Follow the series and the team on X (@getWildEdge), LinkedIn, and GitHub.